

Share
/Contribution%20Margin.png)
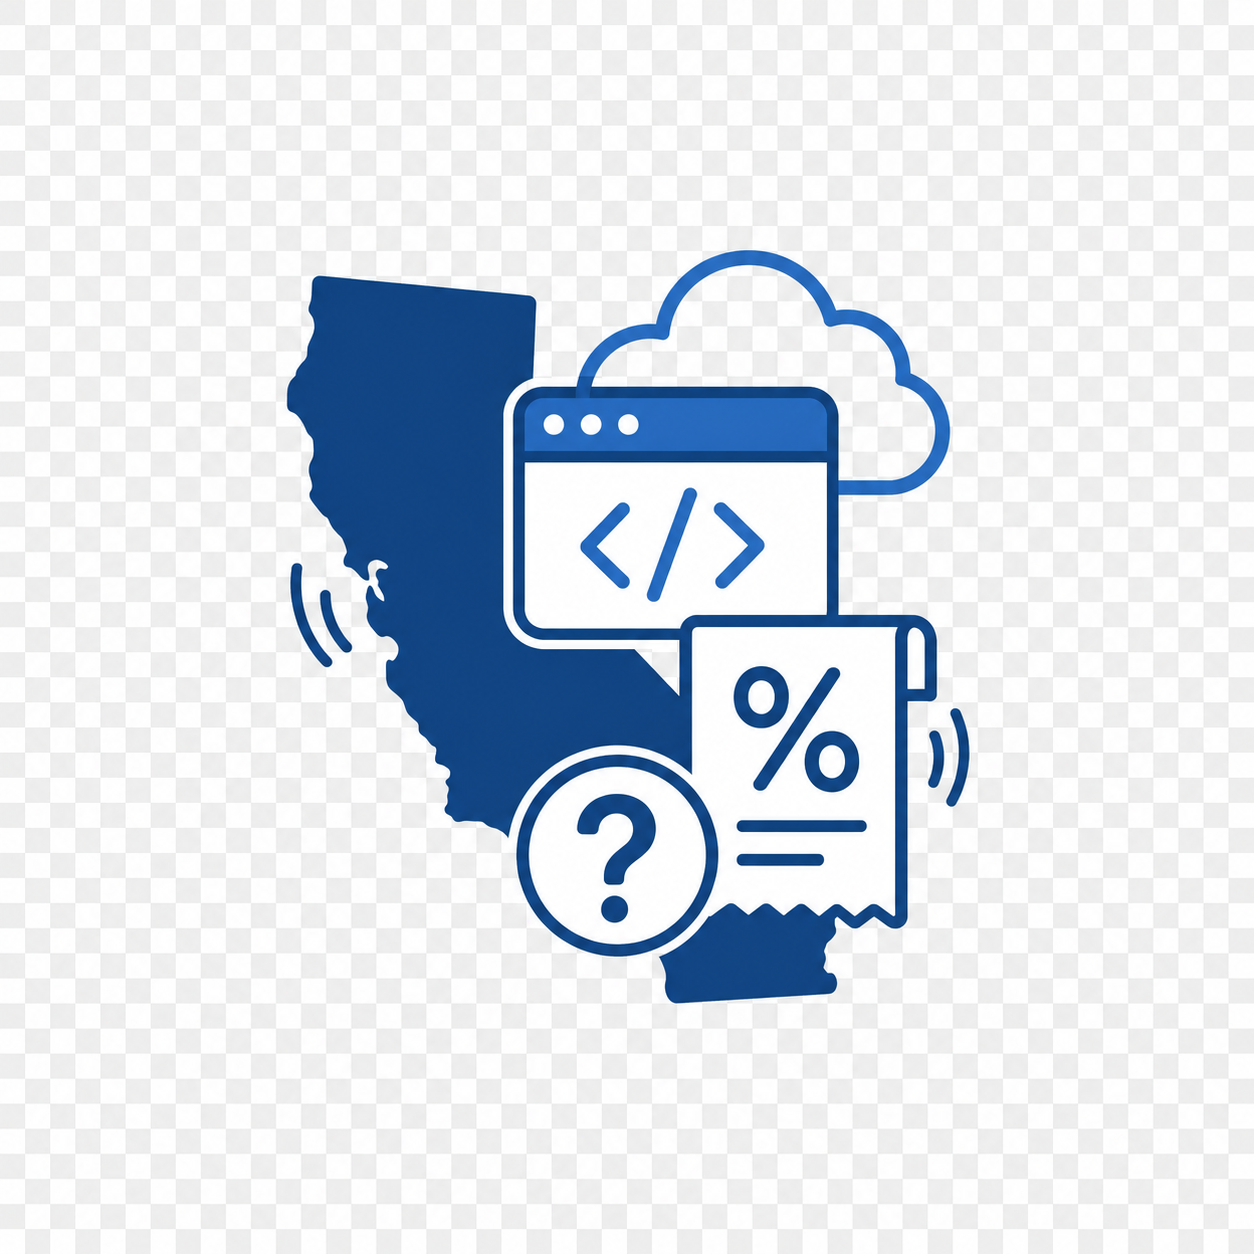
California will tax SaaS and prewritten software starting January 1, 2027. Learn how this affects your business and what steps to take now.

Learn 8 steps to automate your financial processes and enhance mission impact. Grant management transparency for nonprofits, reduced inefficiencies, and ga...

Navigating out-of-state sales tax has become a complex challenge for e-commerce businesses. Learn how to stay compliant and optimize financial operations.