Data visualization and custom KPI dashboards
Great decisions start with actionable data
Transform raw data into clarity. Track your performance in real-time, compare industry metrics, spot trends, and navigate confidently with KPI dashboards customized for your business.

-
 Client Story
"SPRCHRGR has been very creative in helping us think through not only our financial projections but also how we think through all the data and metrics we have to make smarter choices…it's not just the time savings…it's the expertise that helps bolster your business."
Read Case StudyPatricio Utz
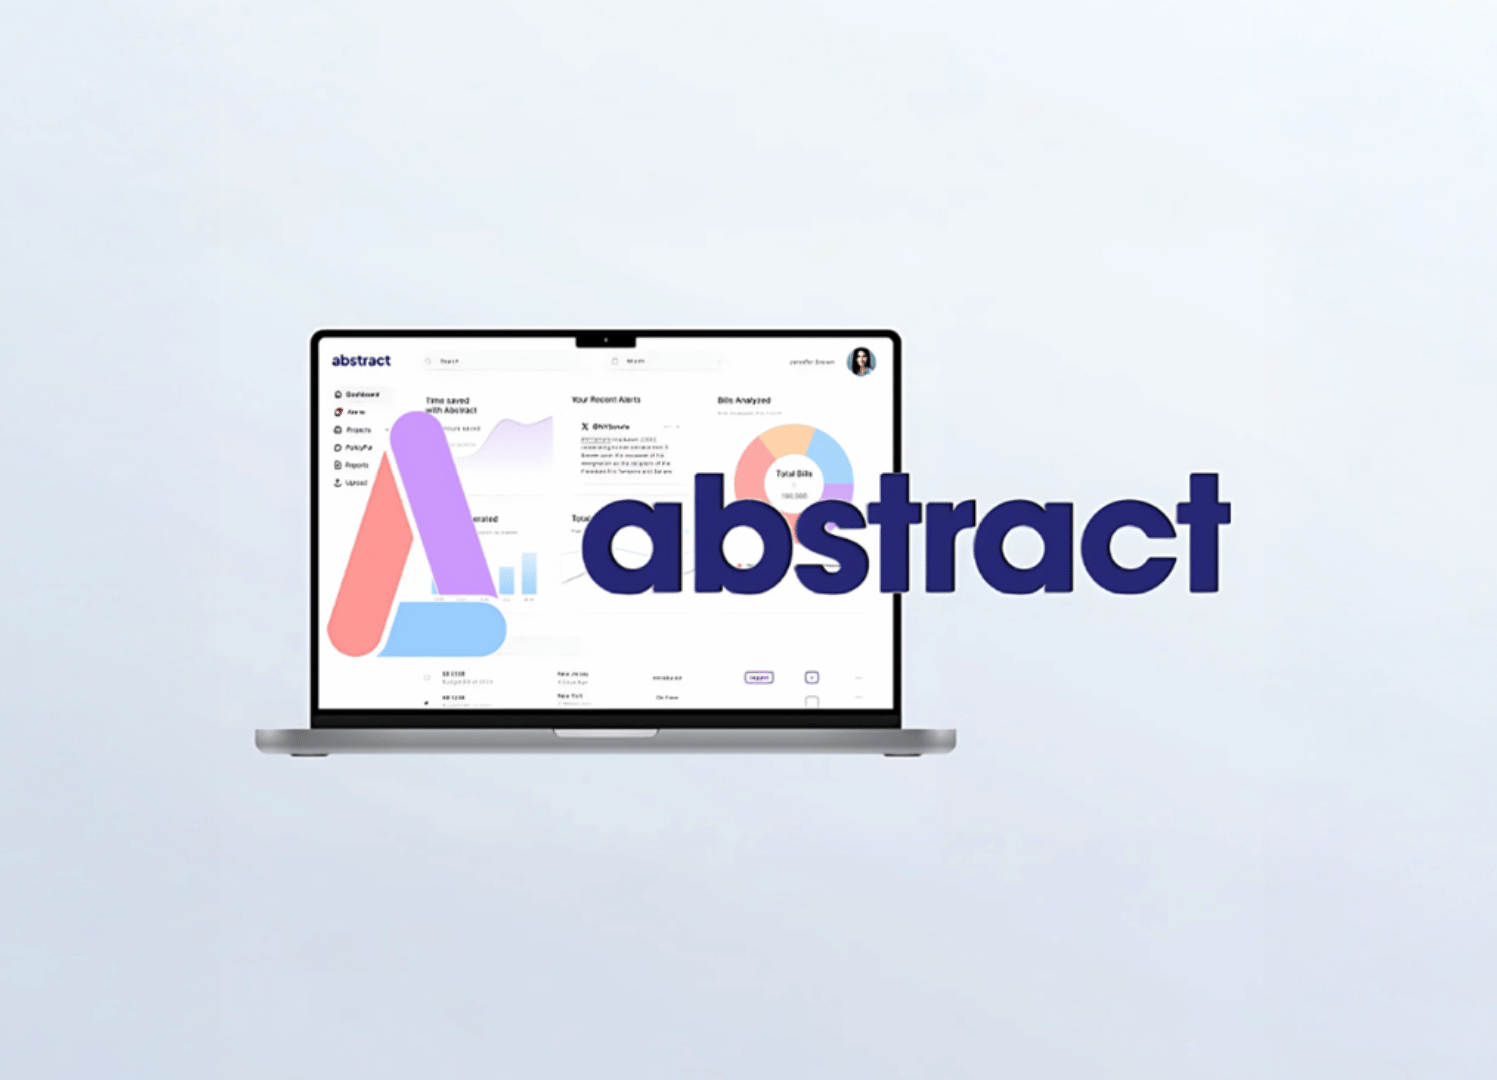
CEO, Co-Founder | Abstract -
 Client Story
"Having solid accounting and finance guidance meant we could focus on scaling our business and securing new partnerships. With the right processes in place, we felt confident in our direction... ready for due diligence, internal staffing, and investor reporting needs in the future."
Read Case StudyRachelle Snyder
Co-CEO & Co-Founder | Arrive Recommerce -
 Client Story
"The difference with SPRCHRGR is they can provide not just the daily, weekly, monthly operating items, but they're also able to flex into FP&A and strategic finance. Having the ability to flex up into those other financial functions has been really helpful for us as a company."
Read Case StudyTim Cantwell
Co-founder & CEO, Tailorbird -
 Client Story
"SPRCHRGR's team stands up with respect to expertise against any other in-house functions at Fortune 500 companies. We have a very clear view on how much each product costs us down to SKU level... Believe me when I say SPRCHRGR was one of those decisions we got right."
Read Case StudyGareth Hosford
CFO & COO | OMORPHO
Supercharge your decision-making, and conquer:

Fragmented data sources
Multiple systems create siloed information and inconsistent reporting. We integrate financial, operational, and customer data into a single source of truth.
/29-68d6029796353.webp)

Messy, manual reporting processes
We create automated reporting solutions that deliver real-time insights. No more wasted hours spent gathering and formatting data for executive meetings.
/Data%20visualization%20500x500%20-%20Manual%20reporting.webp)

Blind spots
A lack of timely data delays critical business decisions. We build visibility of critical trends so you can stay ahead of the curve.
/53-68d602c75d8fd.webp)

Data overload
Too much data, not enough insight? We transform complex data into clear, actionable ideas that embolden your next moves.
/Data%20visualization%20500x500%20-%20Data%20overload.webp)
Access the metrics that matter most to your bottom line
Financial Intelligence
- Cash flow forecasting/trend analysis
- Revenue and profitability insights
- Working capital optimization
- Budget vs. actual tracking
- Automated variance analysis
- Customized KPI monitoring
- And more!
Operational Efficiency
- Real-time efficiency tracking
- Resource utilization dashboards
- Project profitability analysis
- Capacity planning tools
- Supply chain visibility
- Quality metrics monitoring
- And more!
Customer & Sales Analytics
- Customer behavior analysis
- Sales pipeline visualization
- Market trend tracking
- Product performance metrics
- Channel effectiveness
- Customer lifetime value tracking
- And more!
360° visibility of your operations
What can we custom-build for you?
We build live KPI dashboards powered by industry-leading technology applications like Microsoft Power BI
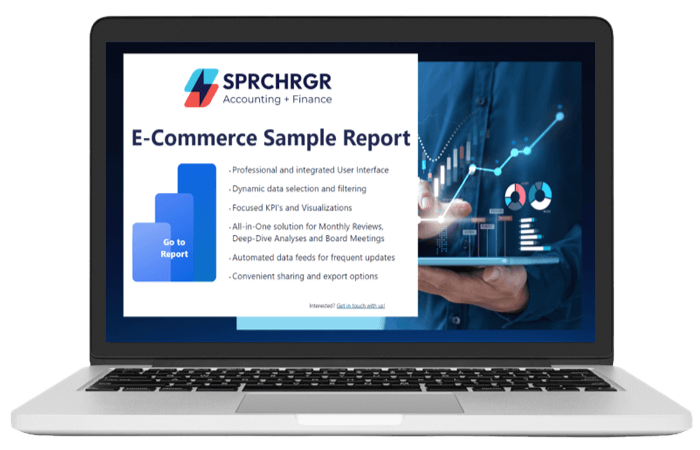
Explore sample KPI dashboards linked below:

Client Story: Data Visualization
“Every step of the way, they helped us build and analyze financial models that led to the right decisions. We felt confident in our direction and were ready for future due diligence, internal staffing, and investor reporting needs.”
Ross Richmond
Co-Founder & Co-CEO | Arrive


meet our team
“The data is only insightful when it is understood. We transform financial data to tell a story that everyone in the organization can easily access and use to make faster decisions."
Mark Wald
Founder & CEO
Our latest insights

Article
Finding the Right Financial Metrics for Your SaaS Company
Software-based businesses have a head start: They're built with the right infrastructure and mindset to generate data-driven insights into the company's fi...

Article
California starts taxing SaaS on January 1, 2027
California just did something it had resisted for years. On June 29, 2026, Governor Newsom signed SB 122, a 2026-27 budget bill that extends the state's sa...

Article
How Manual Processes Erode Mission Impact and Financial Transparency for Nonprofits
"The most dangerous kind of waste is the waste we do not recognize." When Dr. Shigeo Shingo, pioneer of Toyota's Lean manufacturing, made this observation,...

ARTICLE
Does Your E-commerce Business Have to Collect Sales Tax When Selling Out-of-State?
Like many aspects of e-commerce today, sales taxes have become exponentially more complicated. What used to be straightforward for brick-and-mortar retaile...

Article
Finance Integration: 4 Myths That Keep CFOs Stuck in Manual Work
Despite the clear benefits of automation, many finance leaders remain stuck in manual processes — not because they don't see the value, but because they've...


Article
Investor-Ready Finance: How to Increase Your EBITDA Multiple with Our Transaction Readiness Guide
Private investors don’t pay for yesterday’s profits. They pay for tomorrow’s predictable profits, the pace of growth, and how well risk is managed. Great f...
/Multi%20Entity%20ERP%20Implementation-Enterprise%20Financial%20Dashboard%20for%20Executives_1200x630.webp)
Article
Multi-Entity Sage Intacct Implementation: Go From Static Reports to 360-degree Visibility
In finance, your decisions are only as strong as the data you base them on. But if key insights are delayed by days, weeks — or worse, don’t exist — strate...
/Why%20Your%20Patchwork%20Financial%20System%20is%20Killing%20Your%20Growth%20-%20Hes%20How%20to%20Spot%20Potential%20Gaps_1200x630.webp)
Article
Why Your Patchwork Financial System Is Killing Your Growth – Here's How to Spot Potential Gaps
As your firm has grown, you’ve stitched together a time tracker, a billing tool, QuickBooks, and a sea of Excel spreadsheets. You might also have a simple ...
/Spreadsheets%20Dont%20Scale%20-%20How%20to%20Streamline%20Your%20Ops%20by%20Eliminating%20Data%20Silos_1200x630.webp)
Article
Spreadsheets Don’t Scale – How to Streamline Your Ops by Eliminating Data Silos
You’re scaling—bigger clients, more projects, new hires. But instead of gaining momentum, your operations are slowing down. Why? Because your core financia...
/Why%20Your%20Architecture%20and%20Engineering%20Firms%20Profitable%20Projects%20Turn%20Unprofitable%20Halfway%20Through_1200x630.webp)
Article
Why Your A&E Firm's 'Profitable' Projects Turn Unprofitable Halfway Through
The project looked profitable — until it wasn't. But too often, project managers are flying blind while relying on backward-looking spreadsheets and best g...

/Hiring%20Top%20Talent%20Is%20Hard-Wasting%20Their%20Time%20is%20Worse_1200x630.webp)
ARTICLE
Your A&E Talent Strategy is Broken If Your Top People Are Doing This...
Is your firm's brightest talent spending precious hours on administrative busywork instead of billable client work—silently eroding your bottom line? The m...