Holding company CEOs and CFOs a year after a platform acquisition, reporting to a board and a lender.
What each firm contributes after intercompany eliminations, how much covenant headroom is left, and what the next deal does to both.
A year after a platform acquisition, the board meeting and the lender call tend to circle the same question: is the platform deleveraging the way the model said it would? Answering it means rolling up three or four sets of books that were never designed to sit together, and in most holdcos I've worked with that roll-up still lives in a spreadsheet that takes the better part of a month to rebuild.
Here's how I'd walk a holdco CEO through that answer before the meeting, using a working sample dashboard for a fictional platform called Gateway Design Holdings. It owns three design and engineering firms, Ridgeline, Keystone and Confluence, each on its own accounting system, and the dashboard covers the first twelve months under ownership. Every figure in it is invented. Open it alongside this post and click through as we go.
Open on the scorecard, then say where the gap is
The platform made $4.79M of adjusted EBITDA on $22.30M of revenue in its first year, up about 17% on the sellers' pro forma year. Net leverage is 2.79x against a 3.75x covenant, and backlog is $17.10M, a little over nine months of revenue.
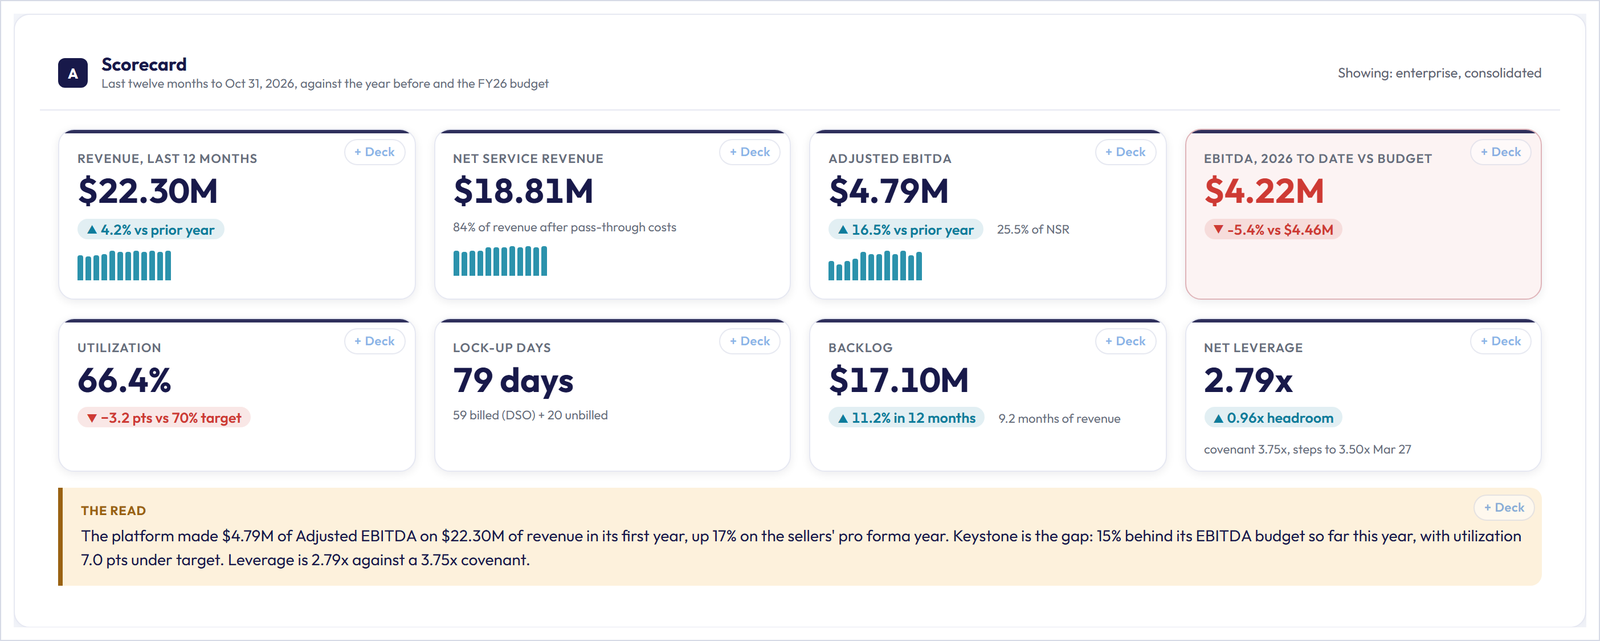
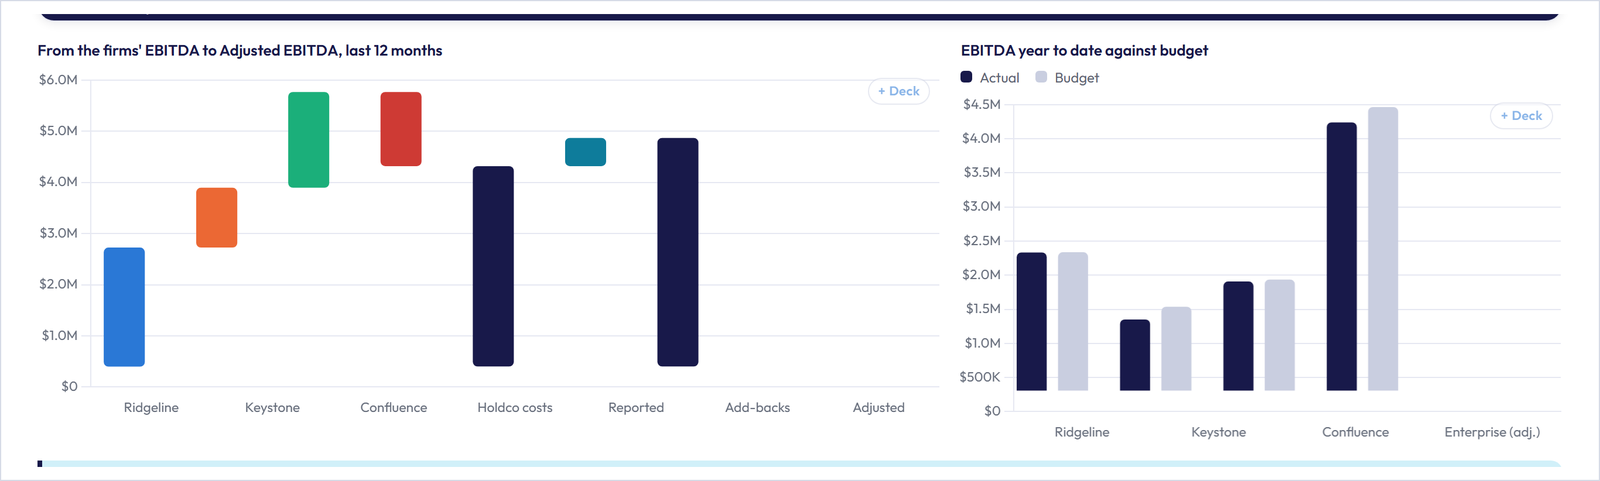
That's the good news, and I'd say it plainly. Then I'd point at the one red card: year to date, EBITDA is $4.22M against a $4.46M budget, 5.4% behind. A board hears a miss much better from you in the first five minutes than from a slide in the appendix, and the dashboard's own callout under the scorecard names where it comes from.
Show what each firm contributes, and what the holdco costs
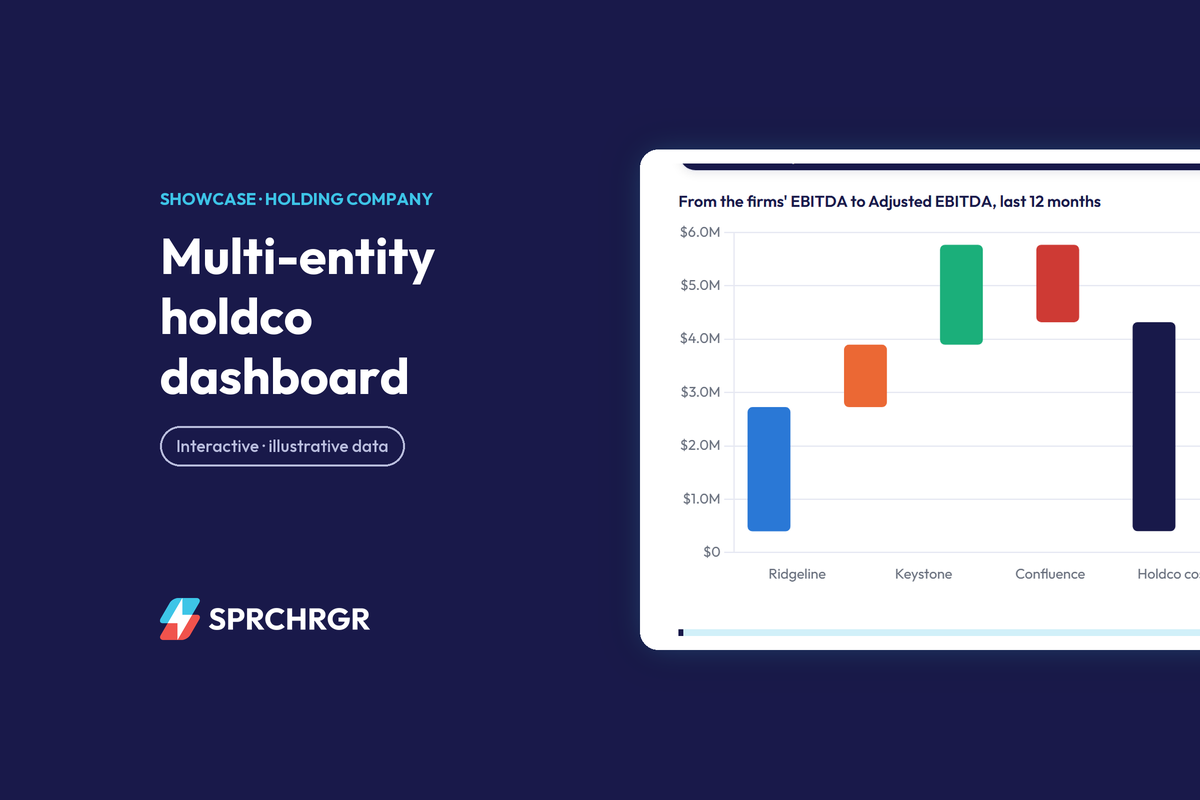
The bridge chart walks from each firm's own EBITDA to the platform number. Ridgeline contributes $2.50M, Confluence $2.00M on the smallest revenue of the three, and Keystone $1.25M. Holdco costs take $1.55M off the top, and $590K of that (the sponsor monitoring fee and one-time deal and integration spend) is added back to reach adjusted EBITDA, which is how the lender will look at it.
The consolidating P&L further down puts each firm's books, the holdco, the eliminations and the consolidated total side by side, and it removes $695K of work the firms billed each other. Without that elimination, enterprise revenue would be overstated by 3.1%, which is the kind of thing a lender's quality-of-earnings team finds in week one if you haven't found it first.
Switch the view to the firm that needs attention
The view switcher at the top changes every section to one firm. Flip it to Keystone and the story gets specific: a 20% margin on net service revenue against 30% at Ridgeline and 46% at Confluence, EBITDA 15.1% behind its own budget, and utilization at 61.0% against a 68% target.
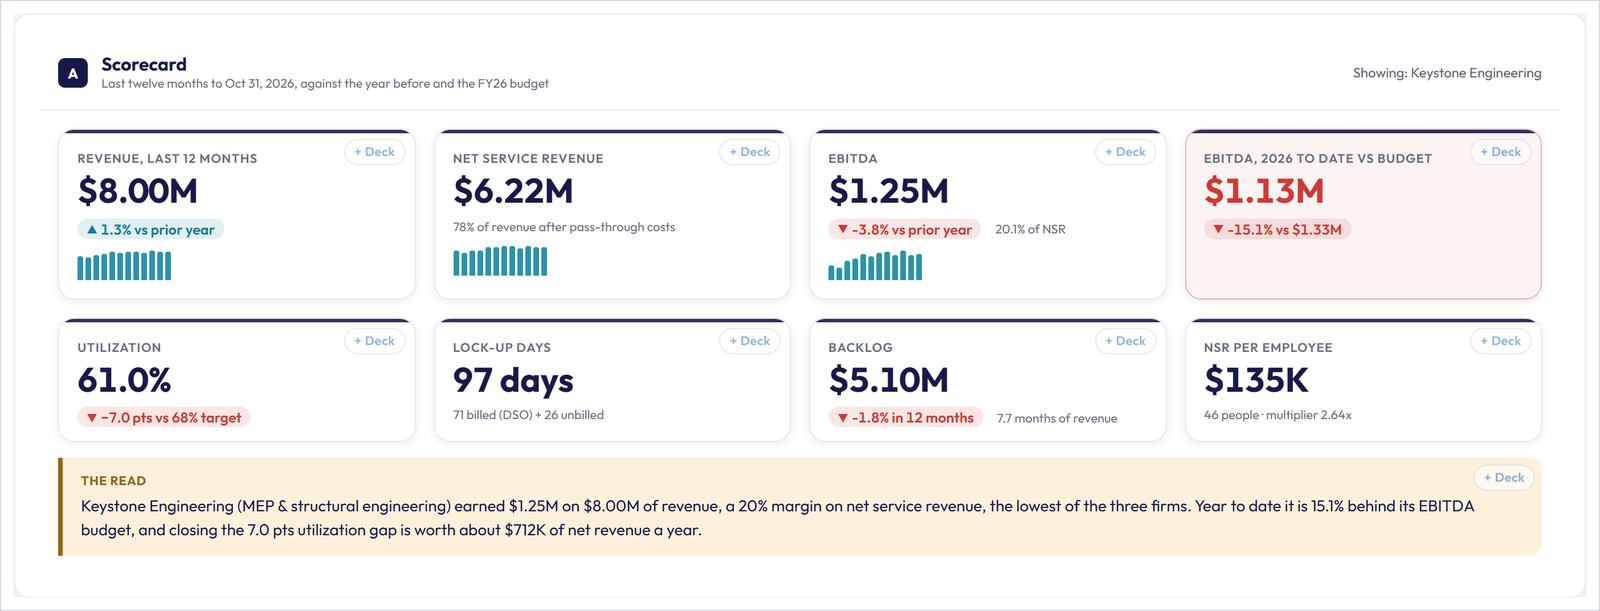
My read is that Keystone has a delivery problem with a price tag on it, since its backlog still covers more than seven months of work. Closing that utilization gap at today's rate per billable hour is worth about $712K a year, and most of that falls to EBITDA because the people are already on payroll. Keystone also carries 97 days of work tied up in billed and unbilled receivables against 70 at Ridgeline, and bringing it to Ridgeline's pace would free roughly $592K of cash. Those are two concrete asks for the Keystone leadership team, with numbers attached, which beats a general note about performance every time.
Answer the leverage question directly
Back on the enterprise view, the cash and covenants section is the page I'd hand the lender. Leverage has come down from 3.56x at close to 2.79x, the term loan has been paid down $750K, fixed charge coverage is 1.85x against a 1.25x minimum, and liquidity is $6.13M including the undrawn revolver.
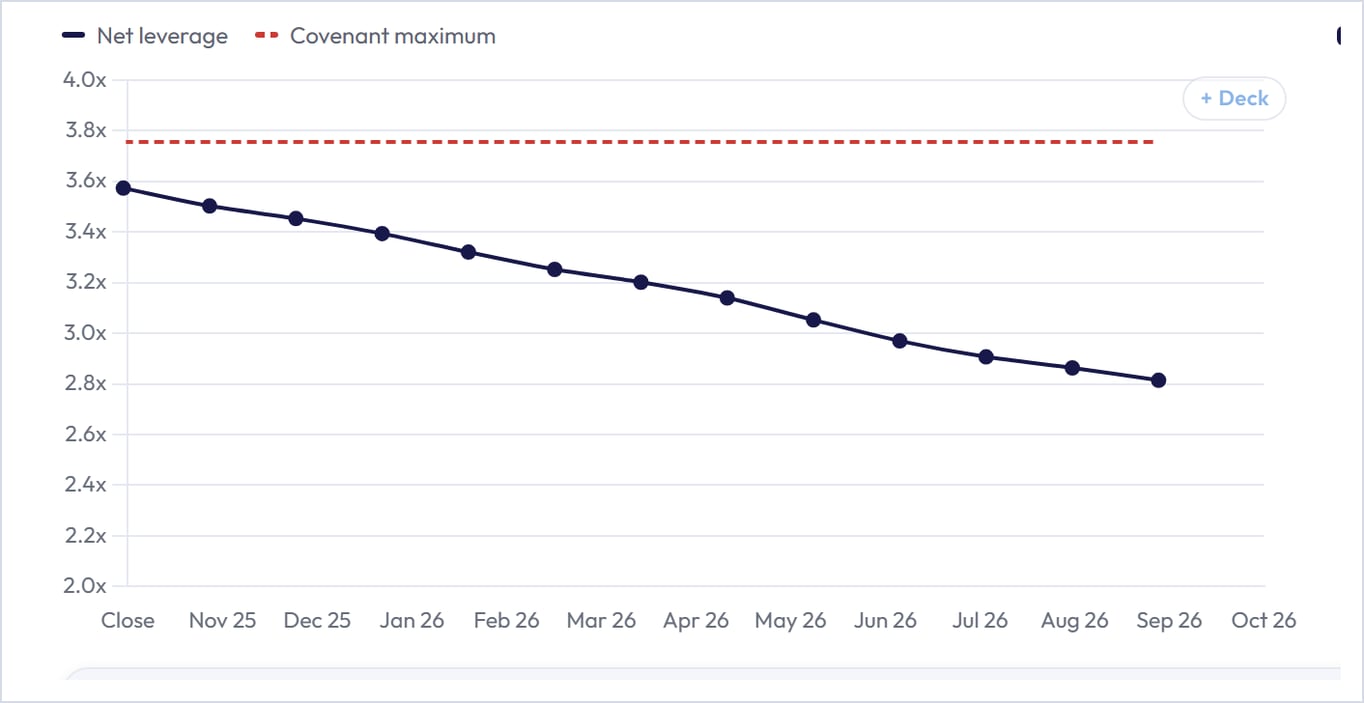
The detail that matters is the step-down. The covenant tightens to 3.50x in March, and the chart shows the platform still has 0.71x of room after it does. So yes, the platform is deleveraging as planned, and the dashboard shows the answer month by month.
Run the next acquisition through the stack
The question after "are we on plan" is almost always "can we do the next one." The last section of the dashboard is a simple what-if: type in a target's revenue, margin, purchase multiple, debt share and expected synergies, and it shows what the deal does to the platform.
At the default inputs (a $6M revenue firm at a 20% margin, bought at 6x with 60% debt), pro forma leverage is 2.88x, which leaves 0.62x under the stepped-down covenant, and EBITDA could fall 18% before a breach. Now push the purchase multiple to 8x, which is where competitive processes tend to end up:
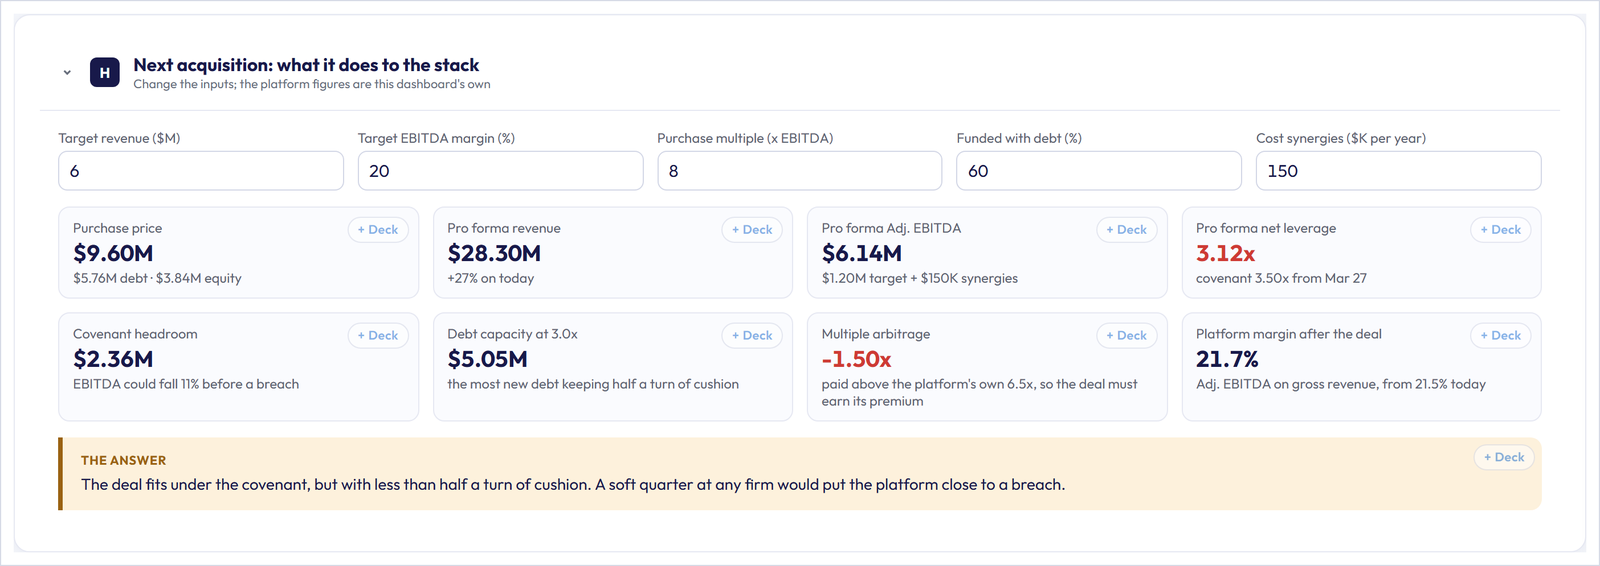
The price rises to $9.60M, leverage goes to 3.12x, and the cushion shrinks to a level where a soft quarter at any one firm puts the platform close to a breach. The deal still fits, but the board can now see what a higher price costs in covenant room before anyone signs a letter of intent.
Build the board deck from the same screen
Every card, chart, table and callout has a + Deck button. Click the ones you want, open the board deck tray, put them in order and download an editable PowerPoint file. Use the board pack preloads the ten elements a holdco board usually wants: three headline KPIs, the scorecard read, the EBITDA bridge, the firm table, revenue by month, the consolidating P&L, the leverage chart and utilization by firm.
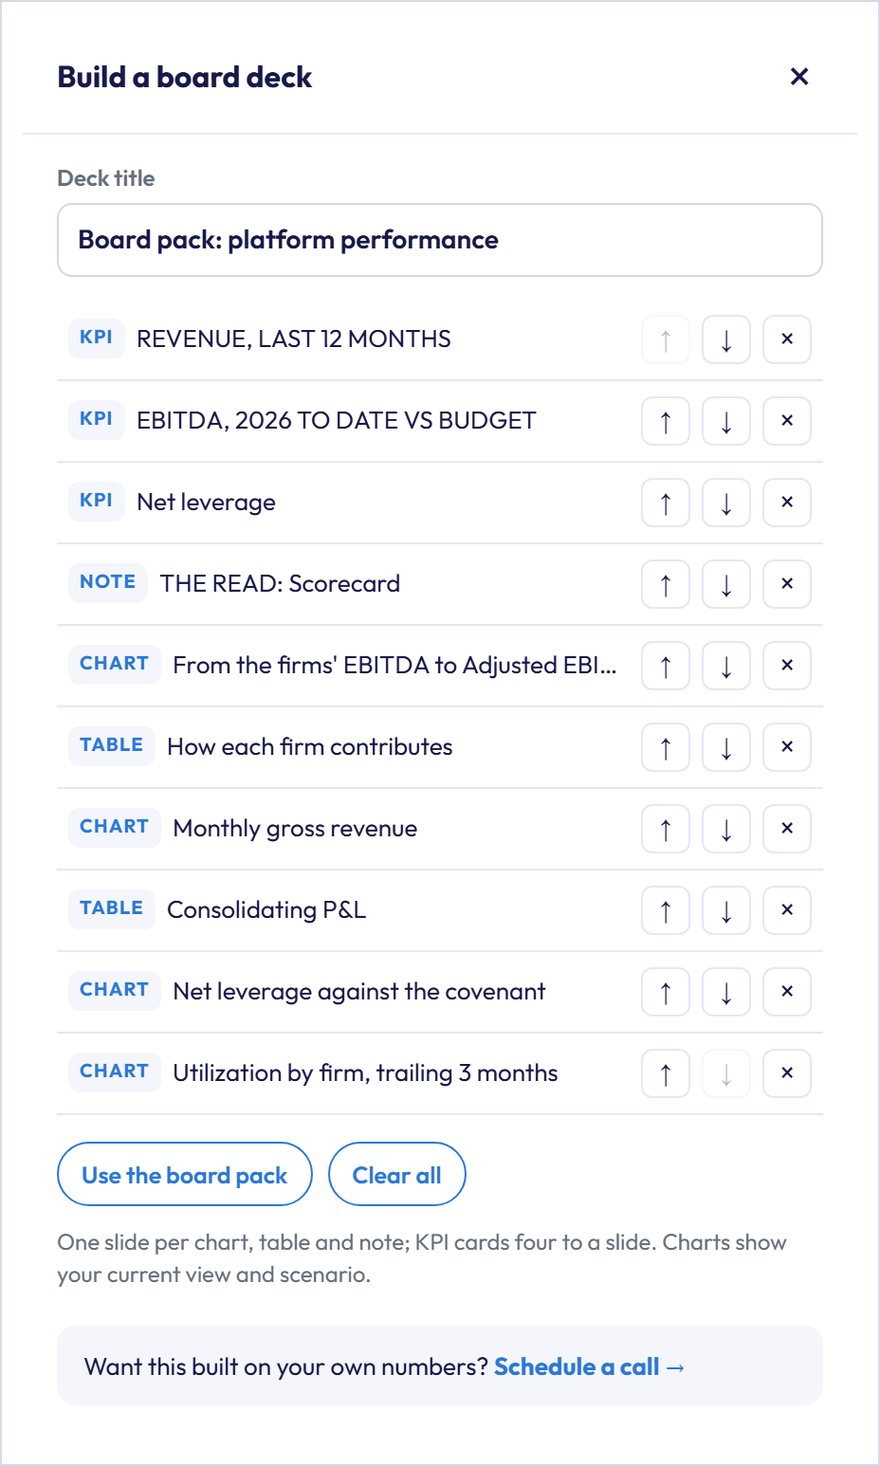
Charts come across as shown, so if you switched to Keystone or changed the acquisition inputs, that's what lands on the slide. Tables arrive as native, editable PowerPoint tables with the formatting intact, and every slide has speaker notes describing what it shows and which view was active. Two minutes of clicking replaces the part of board prep where someone pastes screenshots into last quarter's deck at 11pm.
What it takes to get this on your own platform
In this sample the three firms run on three different systems and the consolidated close takes 18 business days, which is typical for a platform in its first year. In a real engagement we connect read-only to each firm's accounting and project systems and to the holdco ledger, map them all to one chart of accounts, and eliminate intercompany labor on the way in. The scorecard, the consolidating P&L and the covenant tests then refresh after every close, and each new acquisition plugs in as one more feed instead of one more spreadsheet tab.
If you're running a platform, or about to add the next firm to one, schedule a call with our team and we'll walk through what this would look like on your books. The rest of our interactive demos are in the showcase.
Gateway Design Holdings and its three firms are fictional, and every figure in the dashboard and in this post is invented for illustration. Nothing here is drawn from any client's books.
Share