Sponsors and GPs of small real estate funds and syndications, roughly $50 to 300M of assets, and the real estate CPAs, attorneys and lenders who read their numbers.
Which loans can refinance at today's terms, whether the distribution is covered, and what the LPs and the promote are actually worth if everything sold today.
Most sponsors I sit down with three weeks before a quarterly letter want to talk about NOI growth and occupancy, because that's the good news, and I usually steer us to the loan maturity dates instead – that's where the next eighteen months of the fund get decided, and it's where the LPs will look first once they hear rates haven't come back down.
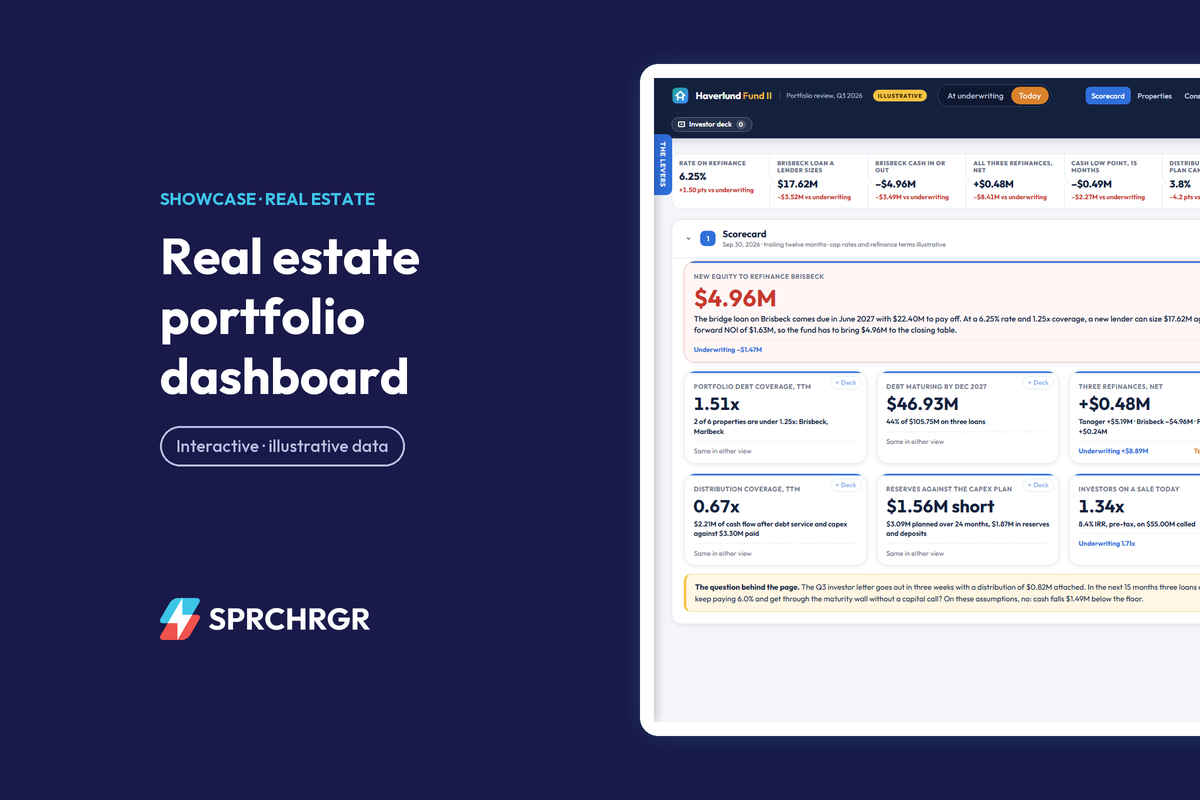
So here's how I'd walk a sponsor through it, using a working sample dashboard we built for a fictional sponsor called Haverlund Real Estate Partners. Every figure in it is invented, but the shape is real: a 2022-vintage fund with $55.0M of investor equity, six properties in six metros, one LLC each, $105.7M of debt, and a 6% distribution paid every quarter since 2023. A switch at the top flips every section between the assumptions the fund was raised on and today's, and that switch is most of the conversation.
Start with coverage, property by property
The quarterly letter says the portfolio made $9.76M of NOI over the last twelve months, up 2.6%, and covered its debt service 1.51 times. All true, and no lender underwrites the portfolio. Each loan is tested on its own building, and the average is carried by Larkhollow, a 216-unit apartment community with a 3.85% agency loan from 2022 that covers 2.41 times.
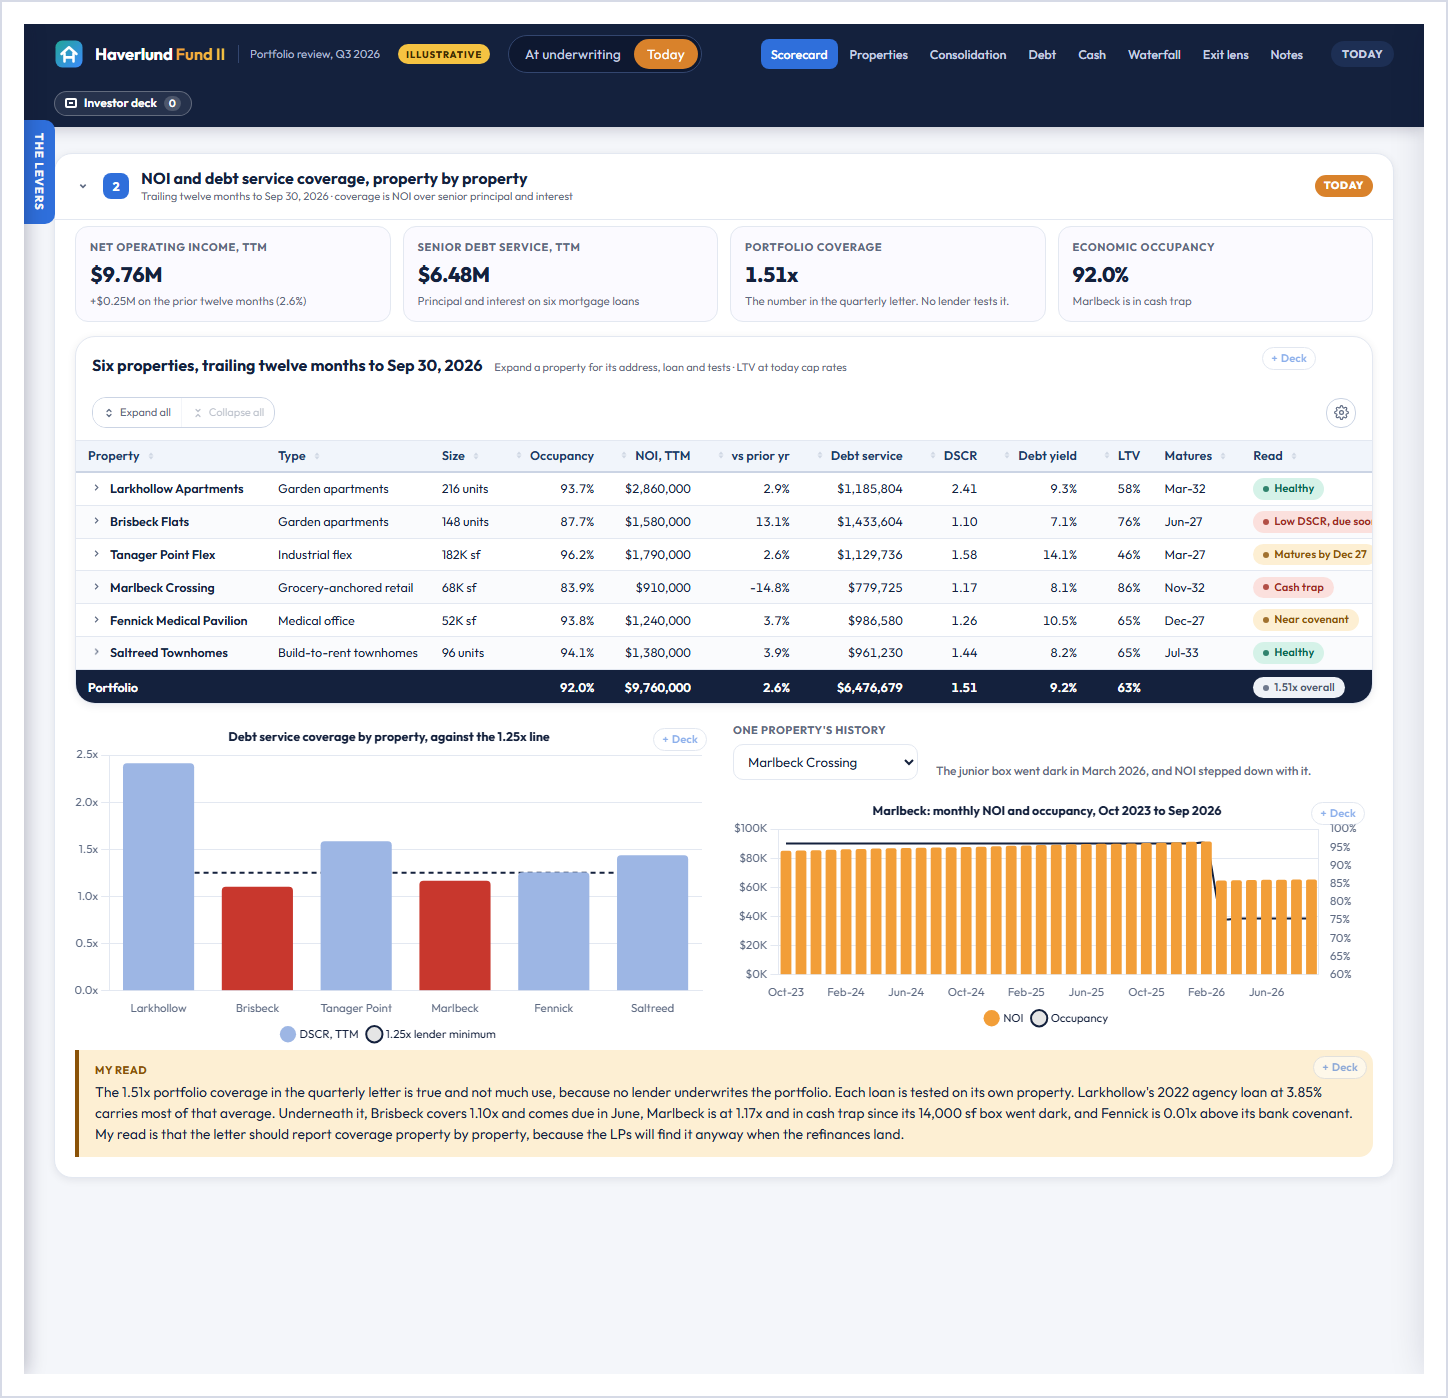
Underneath the average, Brisbeck Flats covers 1.10x and its bridge loan comes due in June. Marlbeck Crossing, a grocery-anchored center, dropped to 1.17x when its 14,000 square-foot junior box went dark in March, which puts it below its CMBS lender's 1.20x trigger and into cash trap. Fennick Medical Pavilion sits 0.01x above its bank's 1.25x covenant.
My read: the letter should show coverage property by property, because the LPs are going to see it that way the day the first refinance lands, and it's better if they see it from you first.
Lay out the maturity wall
$46.9M of the fund's debt, 44% of it, matures in the next 15 months on three loans. After 2027, nothing comes due until 2032.
The three loans are in three very different shapes. Tanager Point, an industrial flex property, carries a 4.35% loan the fund assumed from the seller, so its value has run well ahead of the balance. Brisbeck has a floating bridge loan sized on a renovation business plan. Fennick has a 2023 bank loan at 6.05%, which is close to where rates are today.
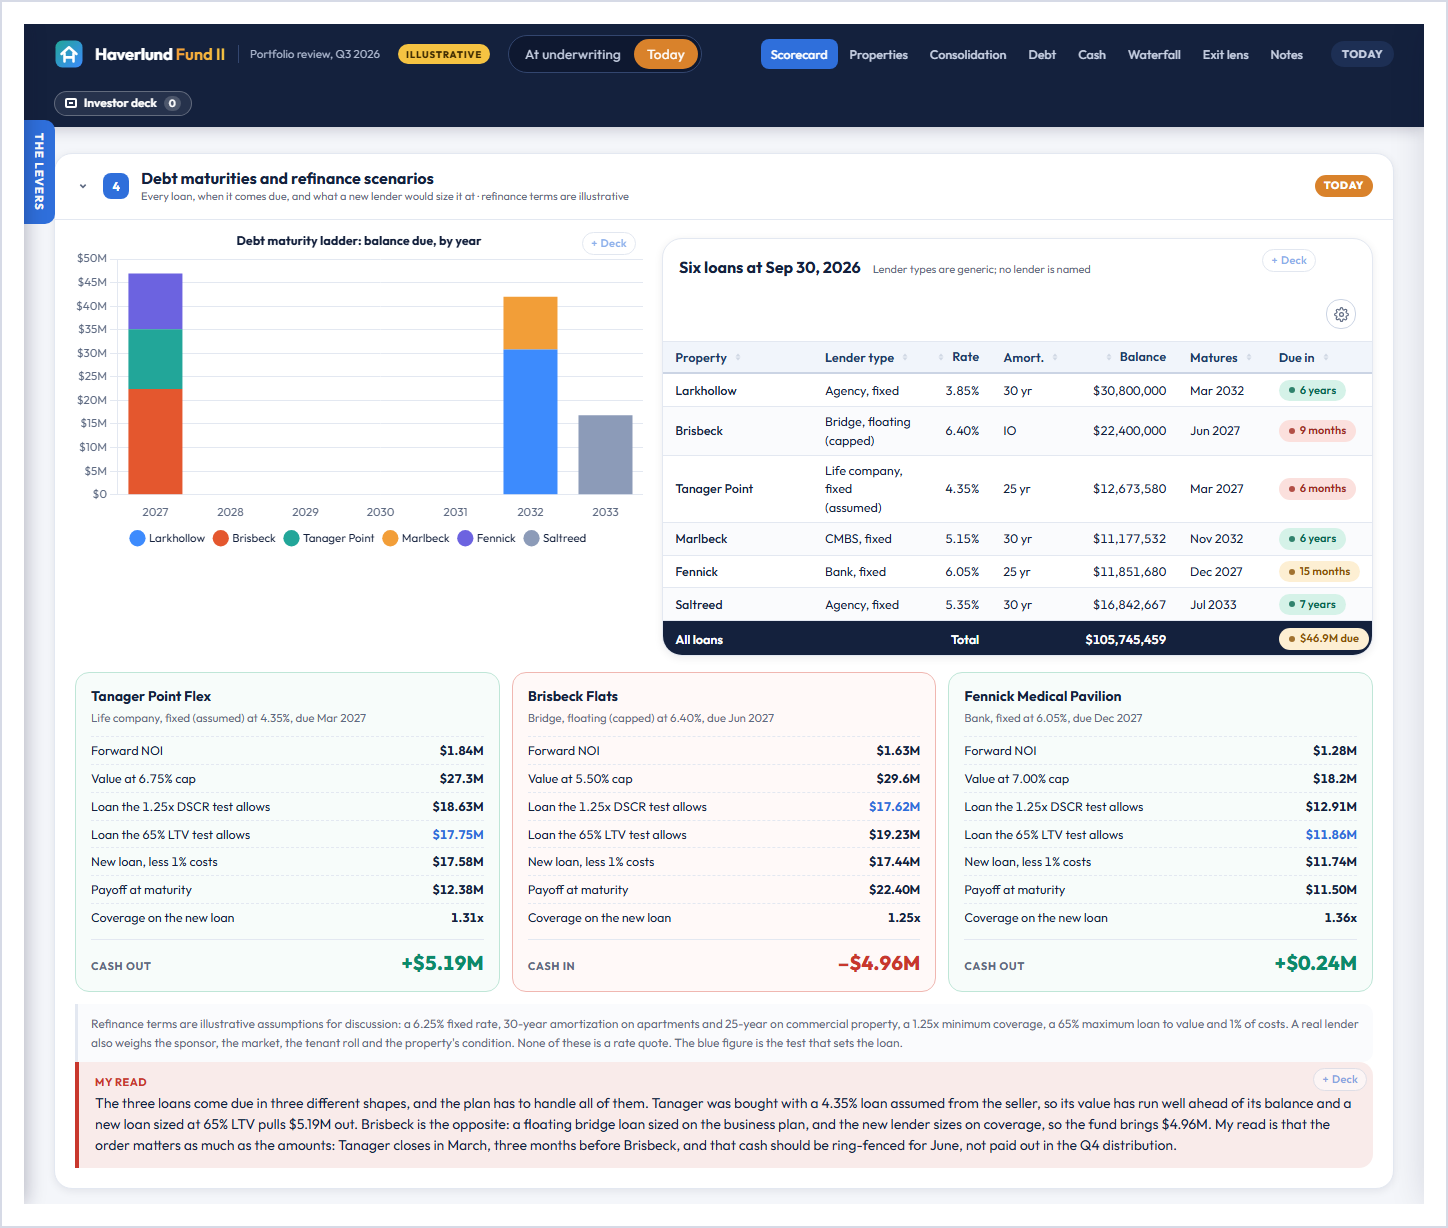
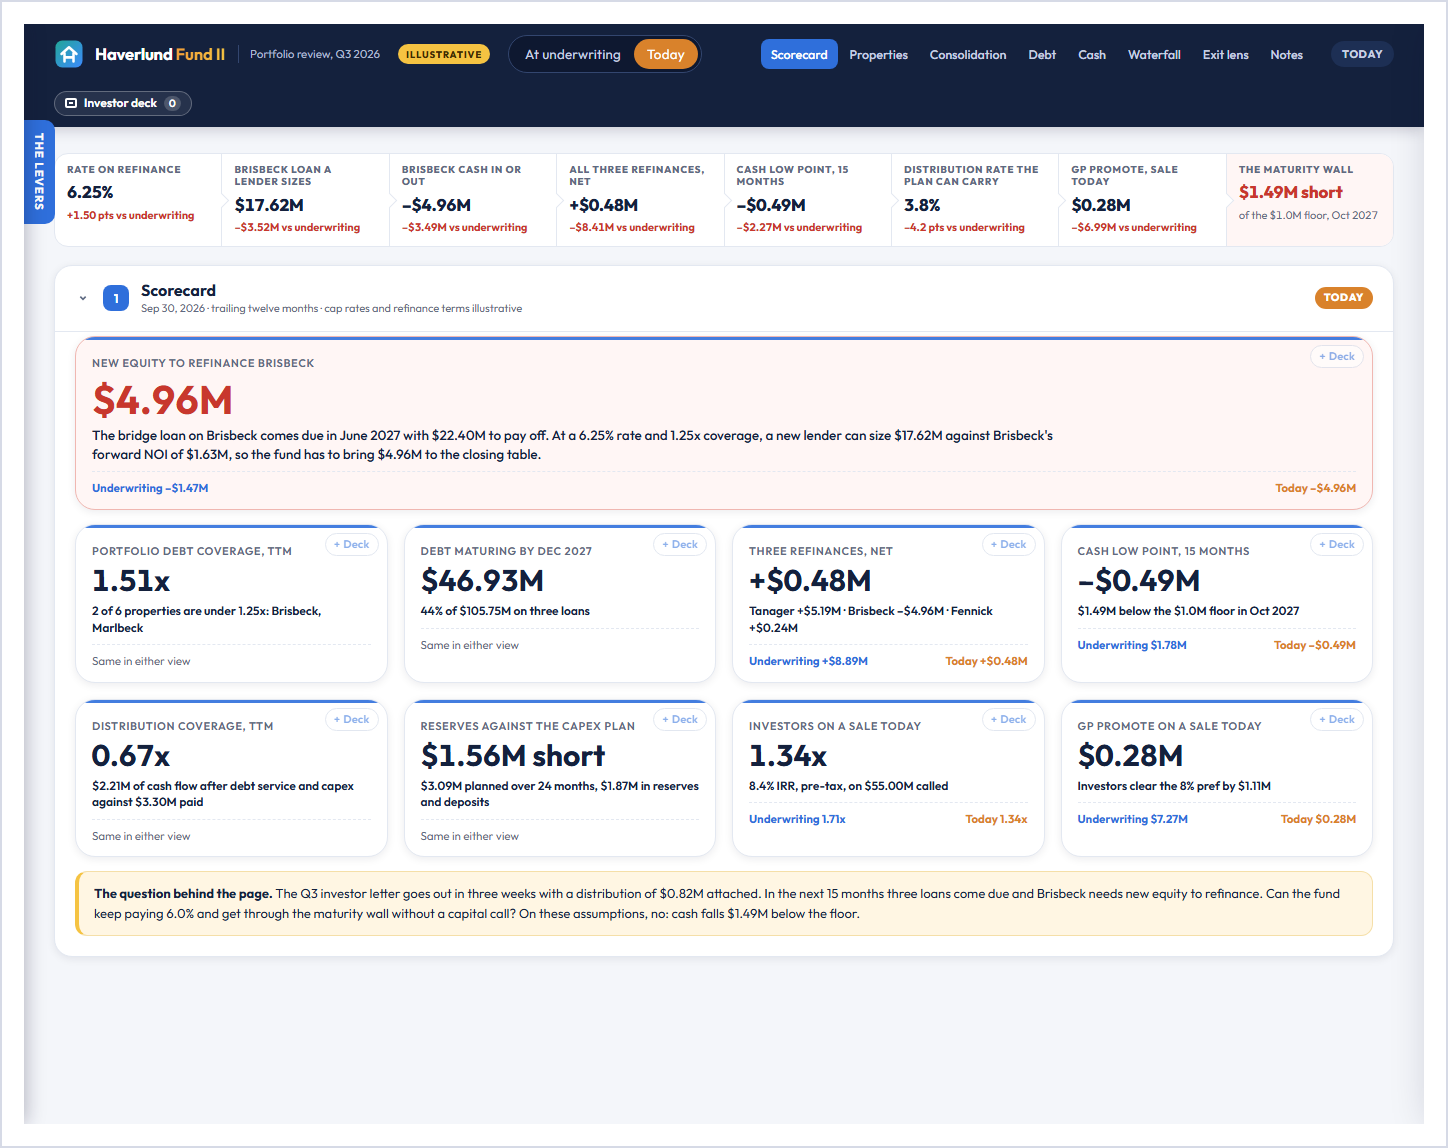
The refinance cards size each new loan the way a lender would, at an illustrative 6.25% rate, a 1.25x minimum coverage and a 65% maximum loan to value, and the lower of the two tests sets the loan. Tanager is limited by value and still pulls $5.19M out. Brisbeck is limited by coverage: its forward NOI of $1.63M supports a $17.62M loan against a $22.40M payoff, so the fund has to bring $4.96M to the closing table. Fennick roughly breaks even at $0.24M out.
My read: the order matters as much as the amounts. Tanager closes in March, three months before Brisbeck, and that cash should be set aside for June rather than paid out in a distribution.
Have the refinance conversation with the rate on the table
Flip the switch to the underwriting assumptions – cap rates about three-quarters of a point lower and a 4.75% refinance rate – and Brisbeck only needs $1.47M, the three refinances net $8.89M of cash out, and the promote on a hypothetical sale is $7.27M. On today's terms the same three loans net $0.48M and the promote is $0.28M.
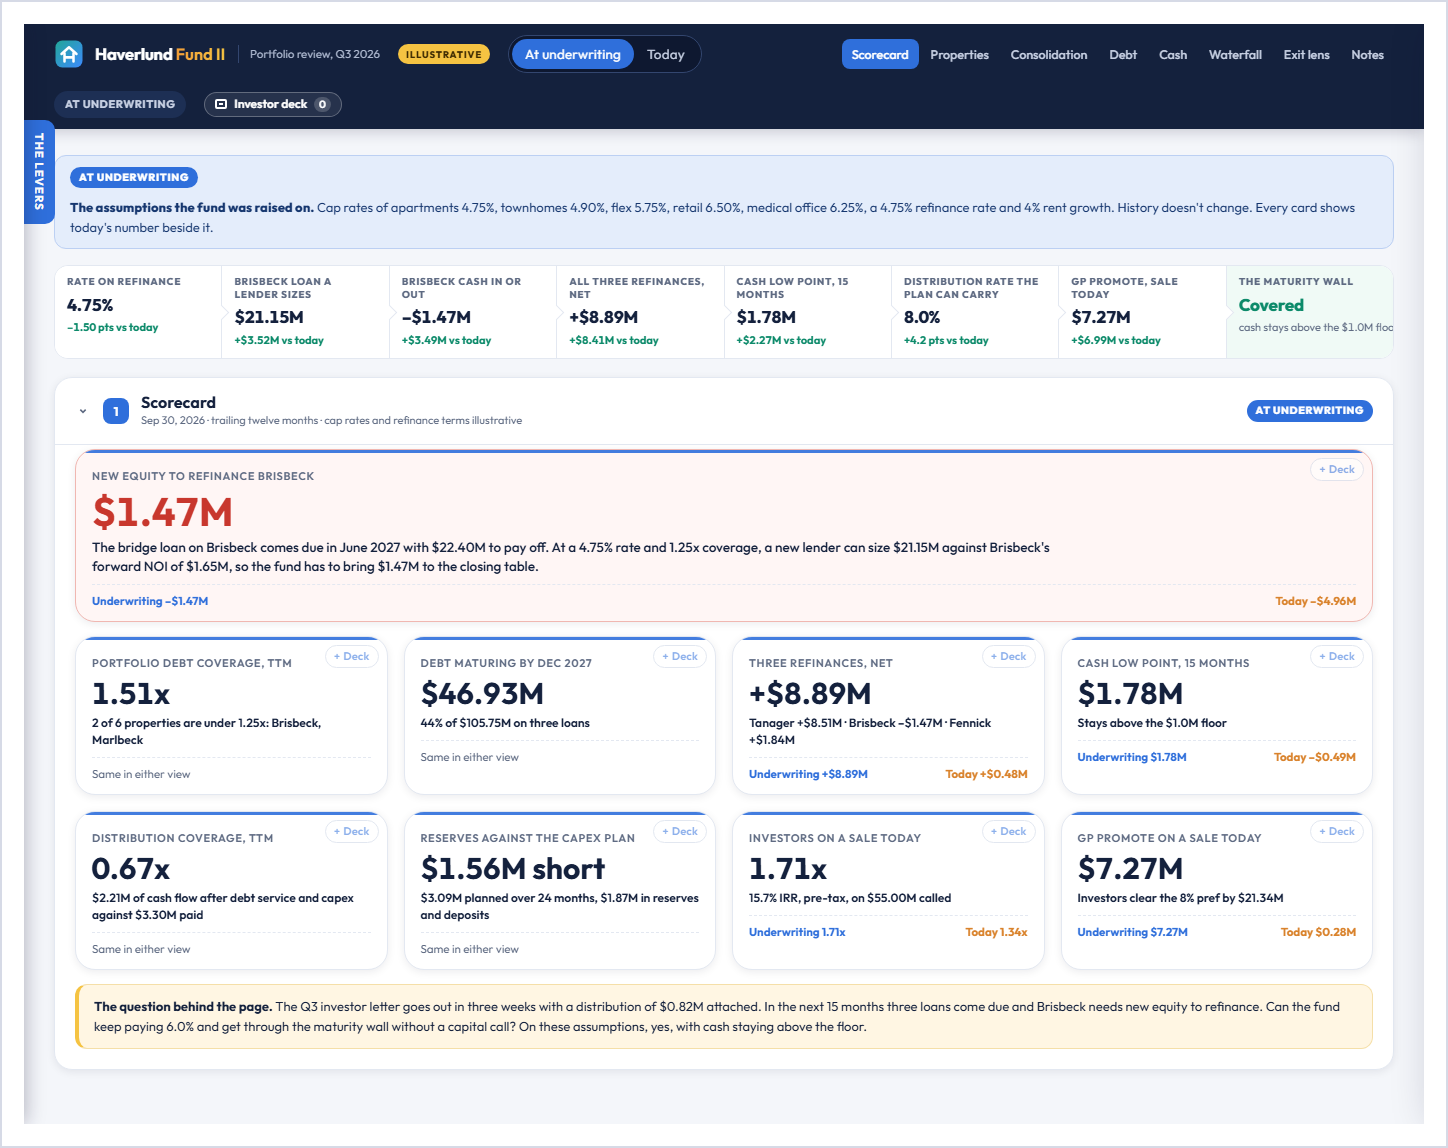
The strip under the switch follows the refinance rate from end to end: the loan a lender sizes, the cash in or out, the cash low point, the distribution rate the plan can carry, and the promote. Drag the rate from 6.25% to 5.75% and the shortfall below the cash floor shrinks from $1.49M to $0.49M. Push it to 6.75% and the shortfall grows to $2.42M. The rates and cap rates are illustrative, not quotes.
My read: the fund was underwritten on terms that no longer exist, and the maturity date is when that bill arrives. That's worth saying plainly in the letter, with the plan attached.
Put the distribution next to the cash plan
Over the last twelve months the fund paid $3.30M of distributions out of $2.21M of cash flow after debt service, capex and reserve deposits, so the distribution was 0.67x covered and the bank balance made up the rest. That worked while nothing was due.
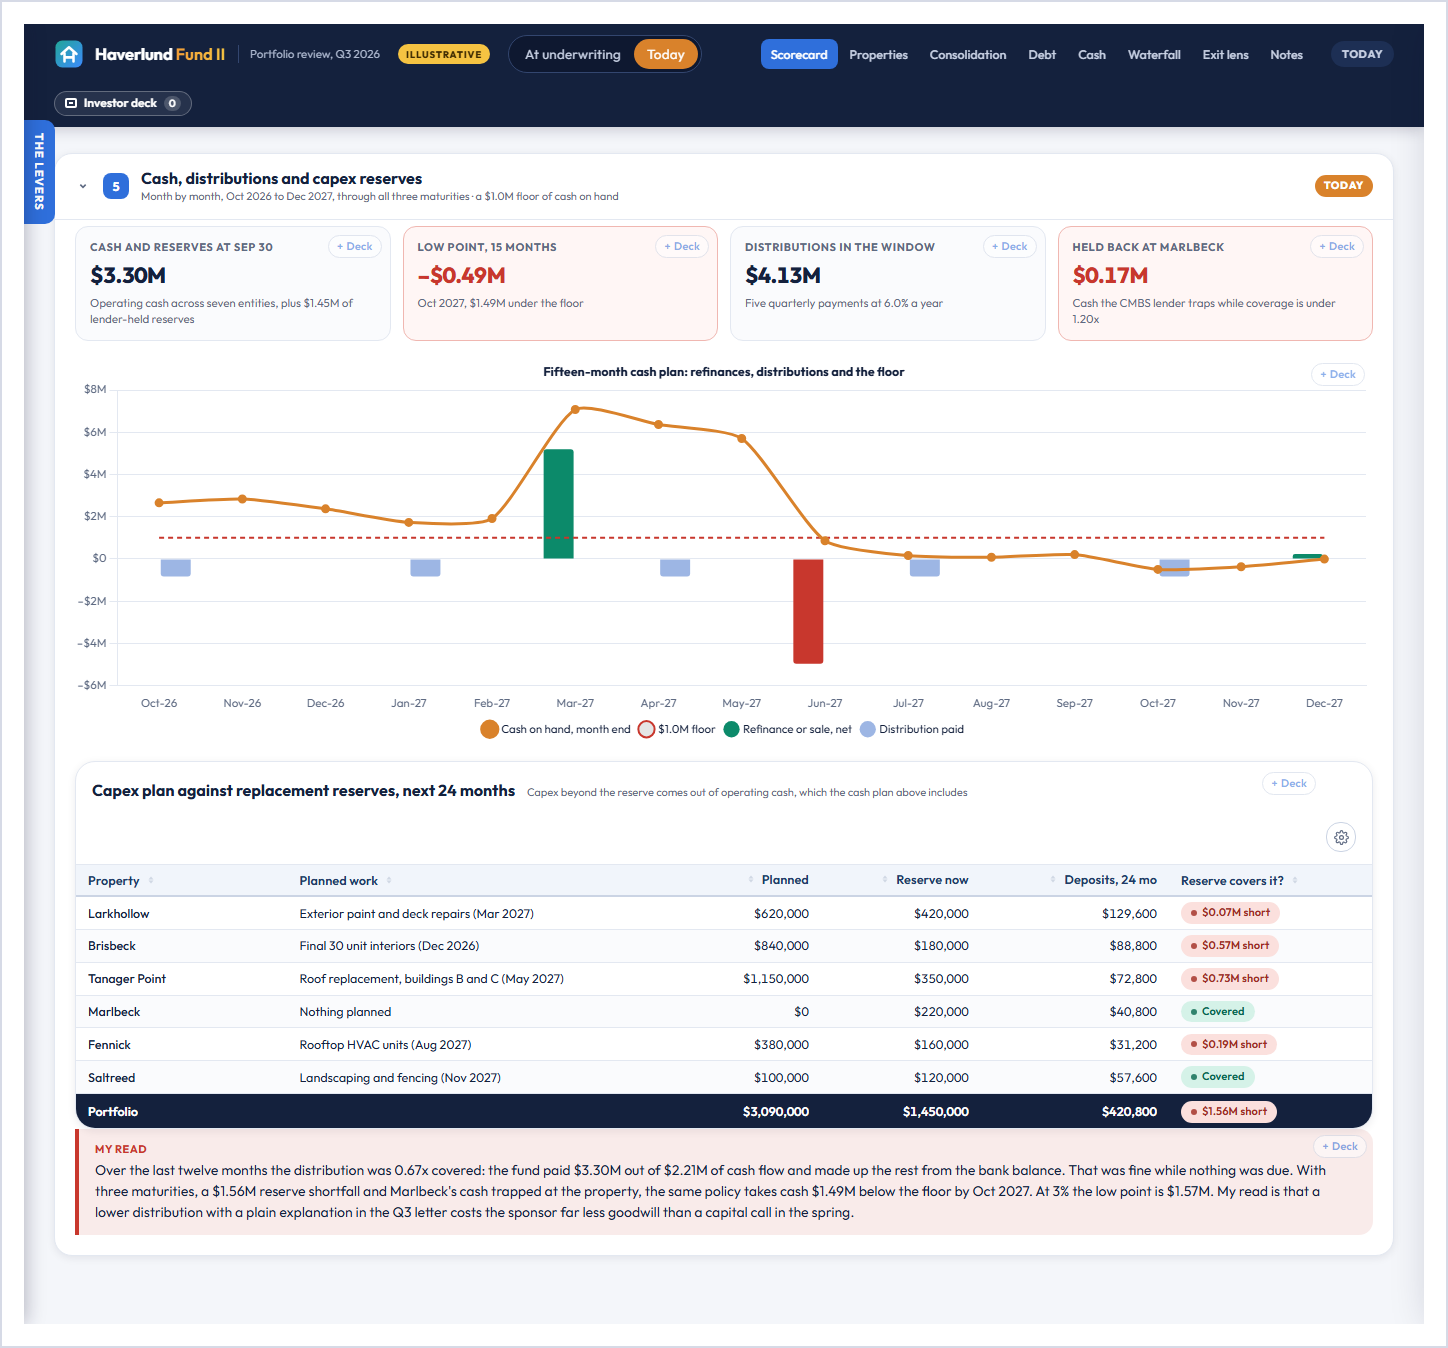
The cash plan runs month by month through December 2027 and takes in the refinances, $3.09M of planned capex against $1.87M of reserves and deposits, and the cash Marlbeck's lender is holding back. At 6% the fund falls $1.49M below a $1.0M floor by October 2027. The highest rate the plan can carry on these assumptions is about 3.8%. At 3%, the low point is $1.57M.
My read: a lower distribution with a plain explanation in the Q3 letter costs the sponsor far less goodwill than a capital call in the spring.
Show the LPs the waterfall before they ask
The waterfall tab answers the LP's question: if everything sold today, where would I be? The hypothetical sale starts from $167.48M of value at illustrative cap rates, takes off 1.5% of costs and $105.75M of loans, and adds back $4.75M of cash and reserves, for $63.97M of net proceeds.
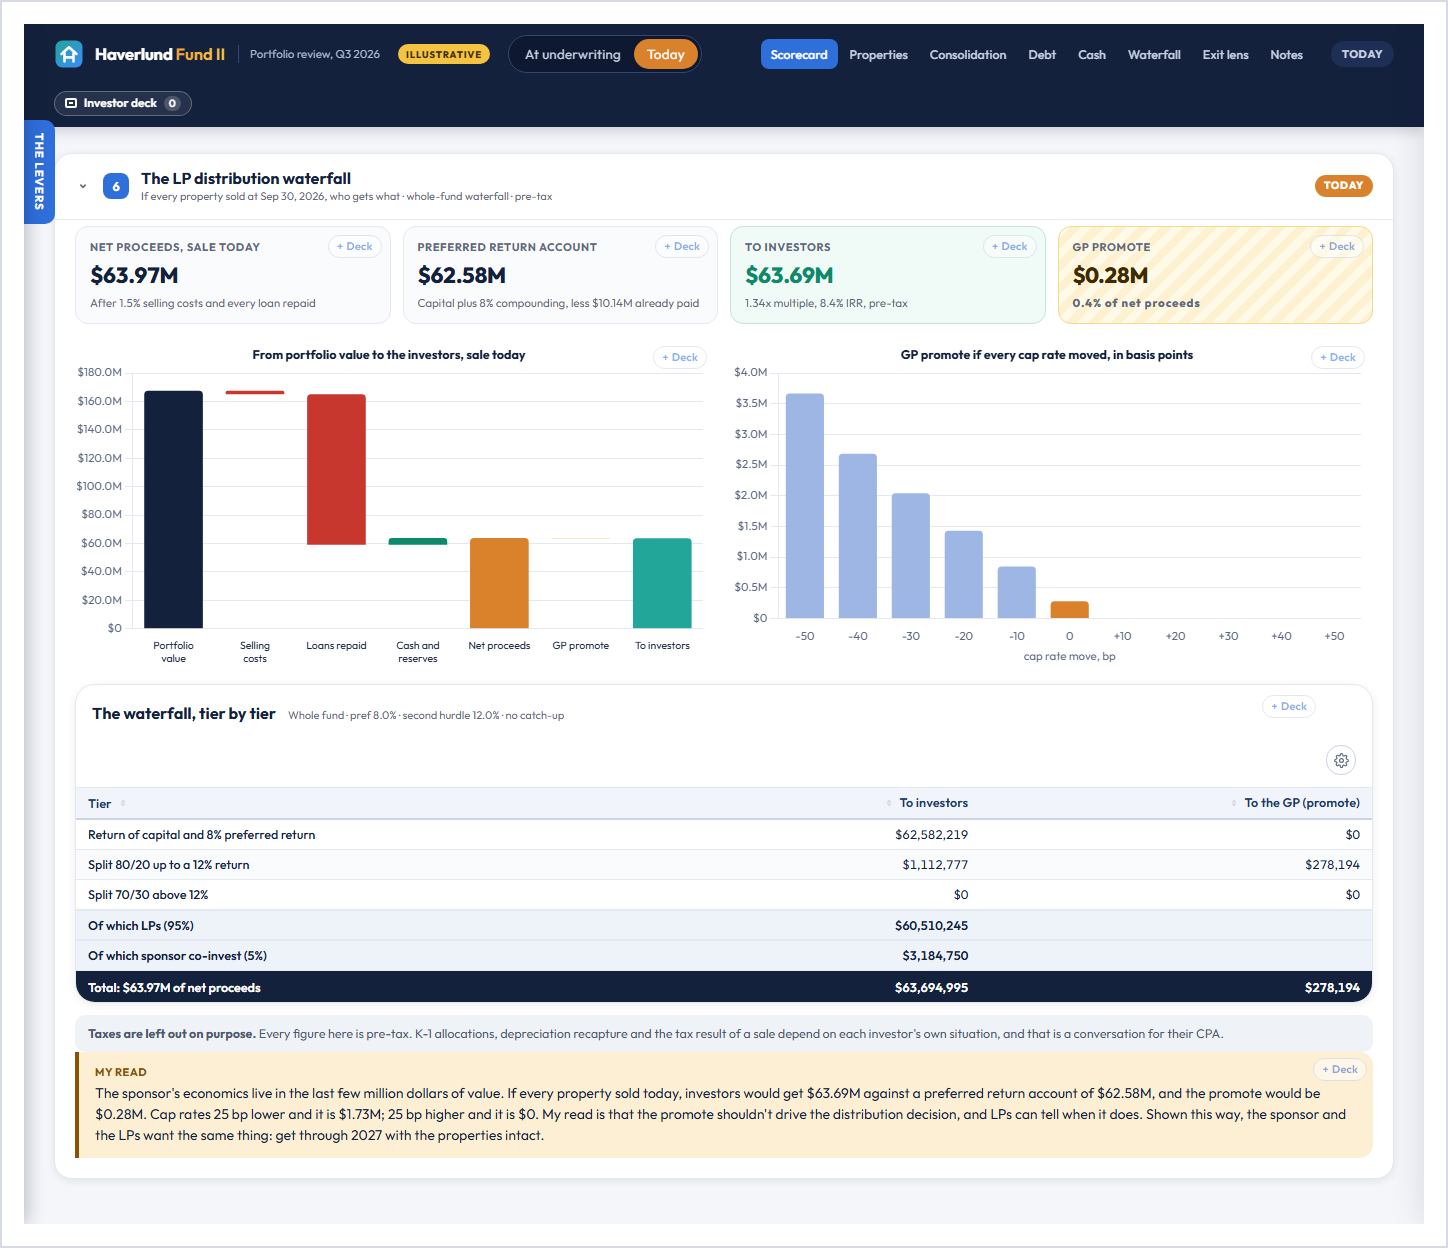
The investors' preferred return account (capital plus 8% compounding, less the $10.14M already paid) stands at $62.58M, so they clear the pref by $1.11M, and the GP's promote is $0.28M. Investors would be at a 1.34x multiple and an 8.4% IRR, pre-tax. The chart beside it shows how thin that is: cap rates 25 basis points lower and the promote is $1.73M, 25 points higher and it's zero. Taxes are left out on purpose, and K-1s, depreciation recapture and the tax result of a sale are a conversation for each investor's CPA.
My read: once the promote is shown this way, the sponsor and the LPs plainly want the same thing, which is to get through 2027 with the properties intact.
Consolidate the entities so the total can be trusted
Six LLCs and a fund means seven sets of books, and the letter needs one number. The consolidation tab puts the six property columns, the fund, the eliminations and the consolidated total side by side. The fund lent Brisbeck $1.5M in 2025 to finish its renovations, so $120K of interest shows up as income in one set of books and expense in another, and consolidated it drops out. The affiliate's 3% property management fee stays in, because the manager sits outside the fund.
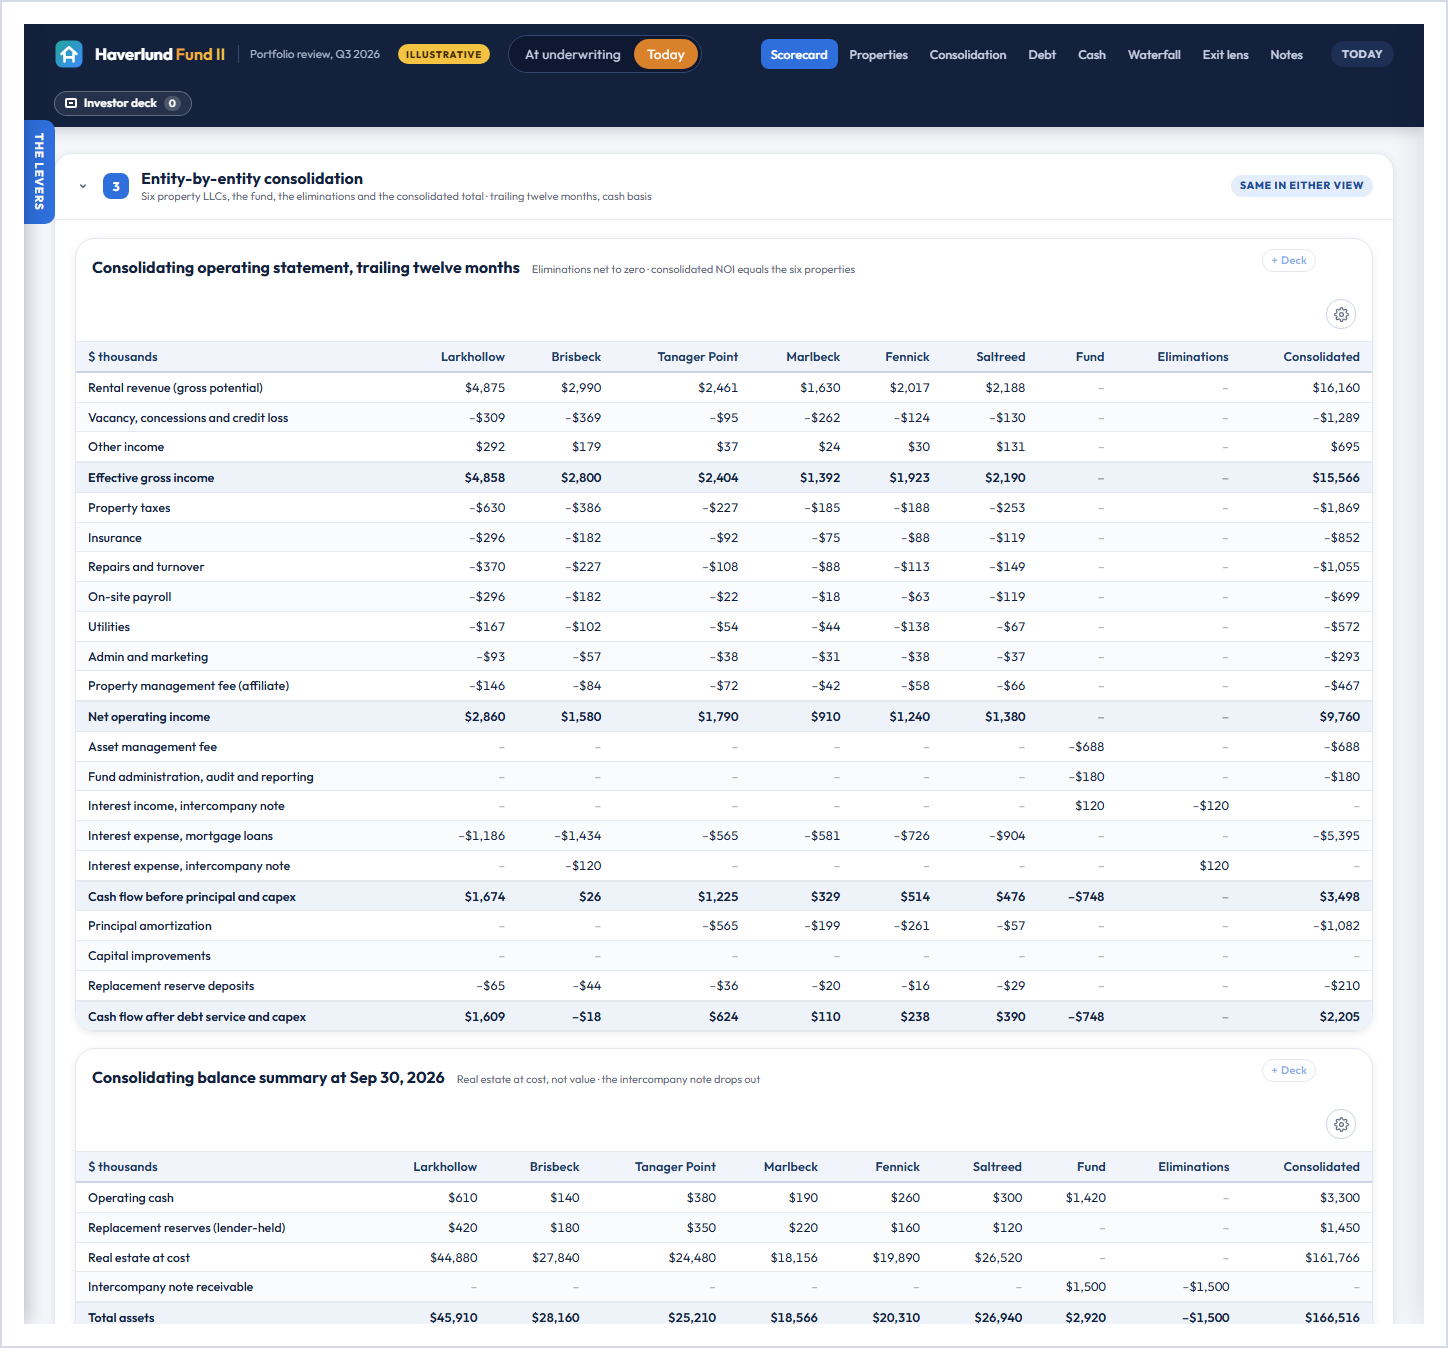
My read: when an LP or a lender can see the property columns add up to the total, they stop asking how the total was built.
Look at it the way a buyer would
The exit lens tab prices each property the way a buyer would and shows what a sale does to the plan. The gain is concentrated in Larkhollow, Brisbeck and Tanager. Marlbeck would return 0.24x on its equity if it sold dark. Selling it in March closes the cash gap, with $1.87M of net cash to the fund, and locks in that loss. Backfilling the box costs $950K of tenant improvements and leasing, makes the cash plan worse first, and lifts the promote to $1.00M once the value catches up. Prepayment and defeasance costs are left out.
My read: the backfill is the better asset decision and the sale is the better liquidity decision, and the fund can only choose the backfill if the distribution comes down to pay for it.
Build the quarterly investor update deck
Every card, chart and table on the page has a + Deck button. Use the quarterly investor update pack loads the set I'd bring to an advisory board or a lender meeting: the scorecard, coverage by property, the consolidating statement, the maturity ladder, the cash plan, the promote chart, the waterfall and the exit lens, ending on a next-steps slide. It downloads as an editable PowerPoint, and the speaker notes record the assumptions you built it on.
What it takes to get this on your own numbers
We connect read-only to each property's books and the fund's, map every entity to one chart of accounts and rebuild the history property by property. Then we put the loans, the reserves, the capital account and the waterfall on top, so coverage, the maturity schedule and the LP report all come from the same numbers, refreshed after every month-end close.
That's CFOptimize – accelerate your growth, built for sponsors who are managing a maturity wall and an investor letter at the same time. If you'd like to see it on your own portfolio, grab time with me and we'll walk through your loans together.
Mark
Haverlund Real Estate Partners, its fund and its properties are fictional, and every figure in the dashboard and in this post is invented for illustration. Nothing here is drawn from any client's books, buildings or loans. Cap rates, refinance terms and waterfall terms are illustrative assumptions, not quotes or appraisals, and nothing here is tax, legal, lending or investment advice.
Share