Owners of $5 to 25M HVAC, plumbing and home-service companies who've started getting calls from private-equity-backed platforms, and the business brokers, CPAs and bankers who advise them.
What margin each type of work really earns, whether the membership plan is a recurring base or a tune-up schedule, why the receivables in QBO don't match the field software, and what all of that does to the price a buyer will pay.
When a service-company owner tells me a platform has called, the first thing they want to know is the multiple, and I usually steer the conversation to the membership plan instead – that's the part of the business a platform buyer is actually underwriting, and it's usually the part the books describe worst.
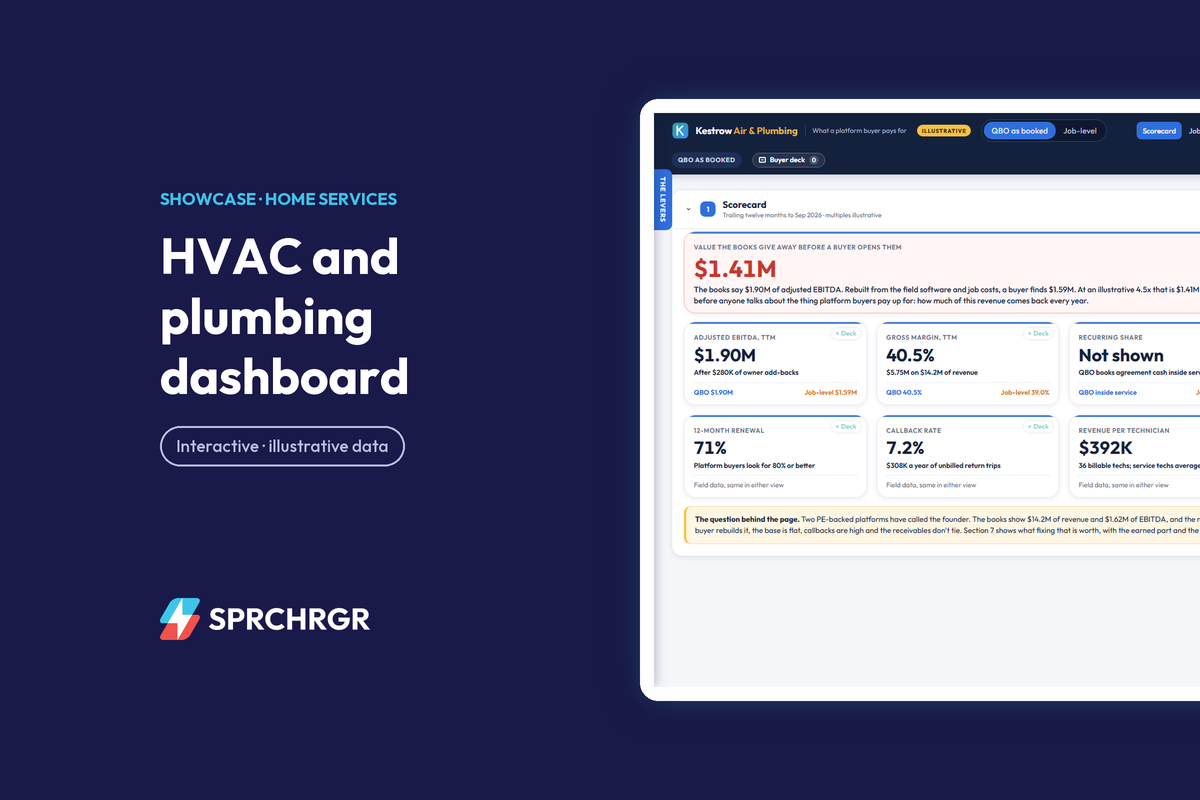
So here's how I'd walk an owner through it, using a working sample dashboard we built for a fictional company called Kestrow Air & Plumbing. Every figure is invented, but the shape is real: a 21-year-old, founder-owned residential and light-commercial HVAC and plumbing company with 36 technicians, 38 trucks, $14.2M of revenue and a $22-a-month membership plan. A switch at the top flips every section between QBO as booked and the same company rebuilt from the field-service software and job costs, which is what a buyer's quality-of-earnings team will rebuild anyway.
Start with the two EBITDA numbers
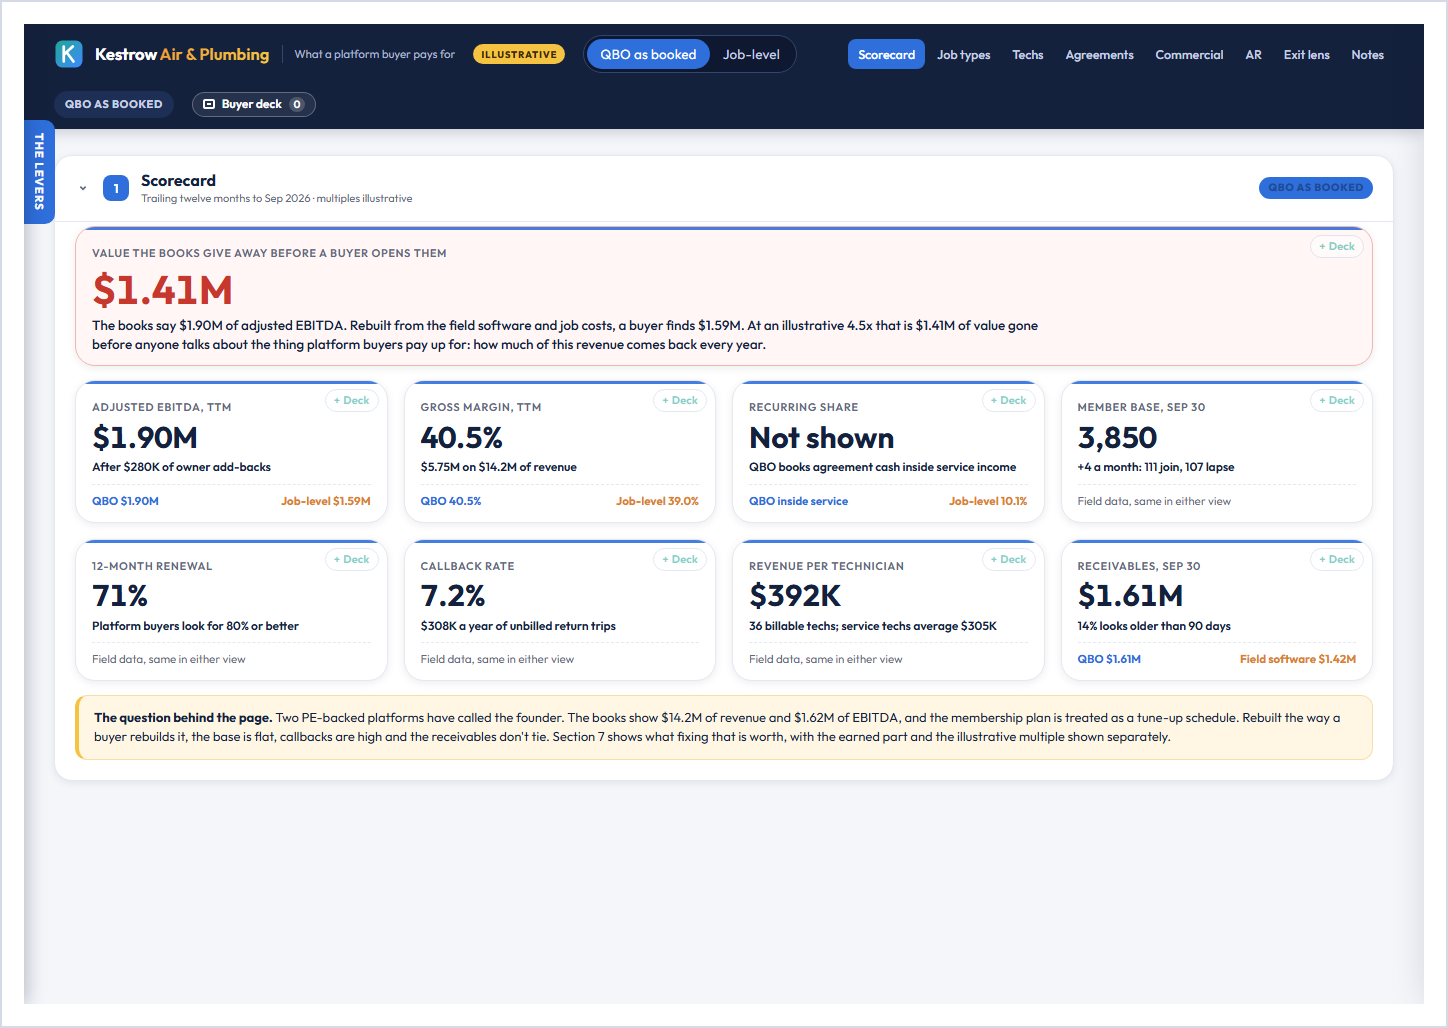
On the books Kestrow looks like a good shop: $14.2M of revenue, 40.5% gross margin and $1.62M of EBITDA, or $1.90M once you add back the owner's pay above a market general manager and a personal vehicle. Rebuild it from the field data and four things come out.
Annual membership plans are booked as revenue when the cash arrives, so $29K hasn't been earned yet. Invoices the techs voided in the field software are still open in QBO, along with a few that synced twice, which is another $65K of revenue that never happened. The financing partner funds installs net of its fee, and nobody booked the fee ($38K). And two commercial retrofits are running ahead of their estimates, which takes $182K of gross profit back out once they're re-estimated at the cost they've actually run.
That leaves $1.59M of buyer-adjusted EBITDA. At an illustrative 4.5x, the difference is $1.41M of value gone before anyone talks about what makes a service business worth more.
My read: none of these items is big on its own, but a buyer who finds four of them assumes there's a fifth, and that's when the diligence gets expensive.
Show margin by job type
QBO has three income accounts, so the owner sees service at 53% gross margin, installs at 35% and commercial at 19.5%. The membership fees are buried inside service income. Charge the callbacks and warranty trips back to the installs that caused them, book the dealer fees, and break the agreements out on their own line, and the picture changes: service earns 58%, installs 30%, commercial projects 13% on the current estimate, and agreements 46%.
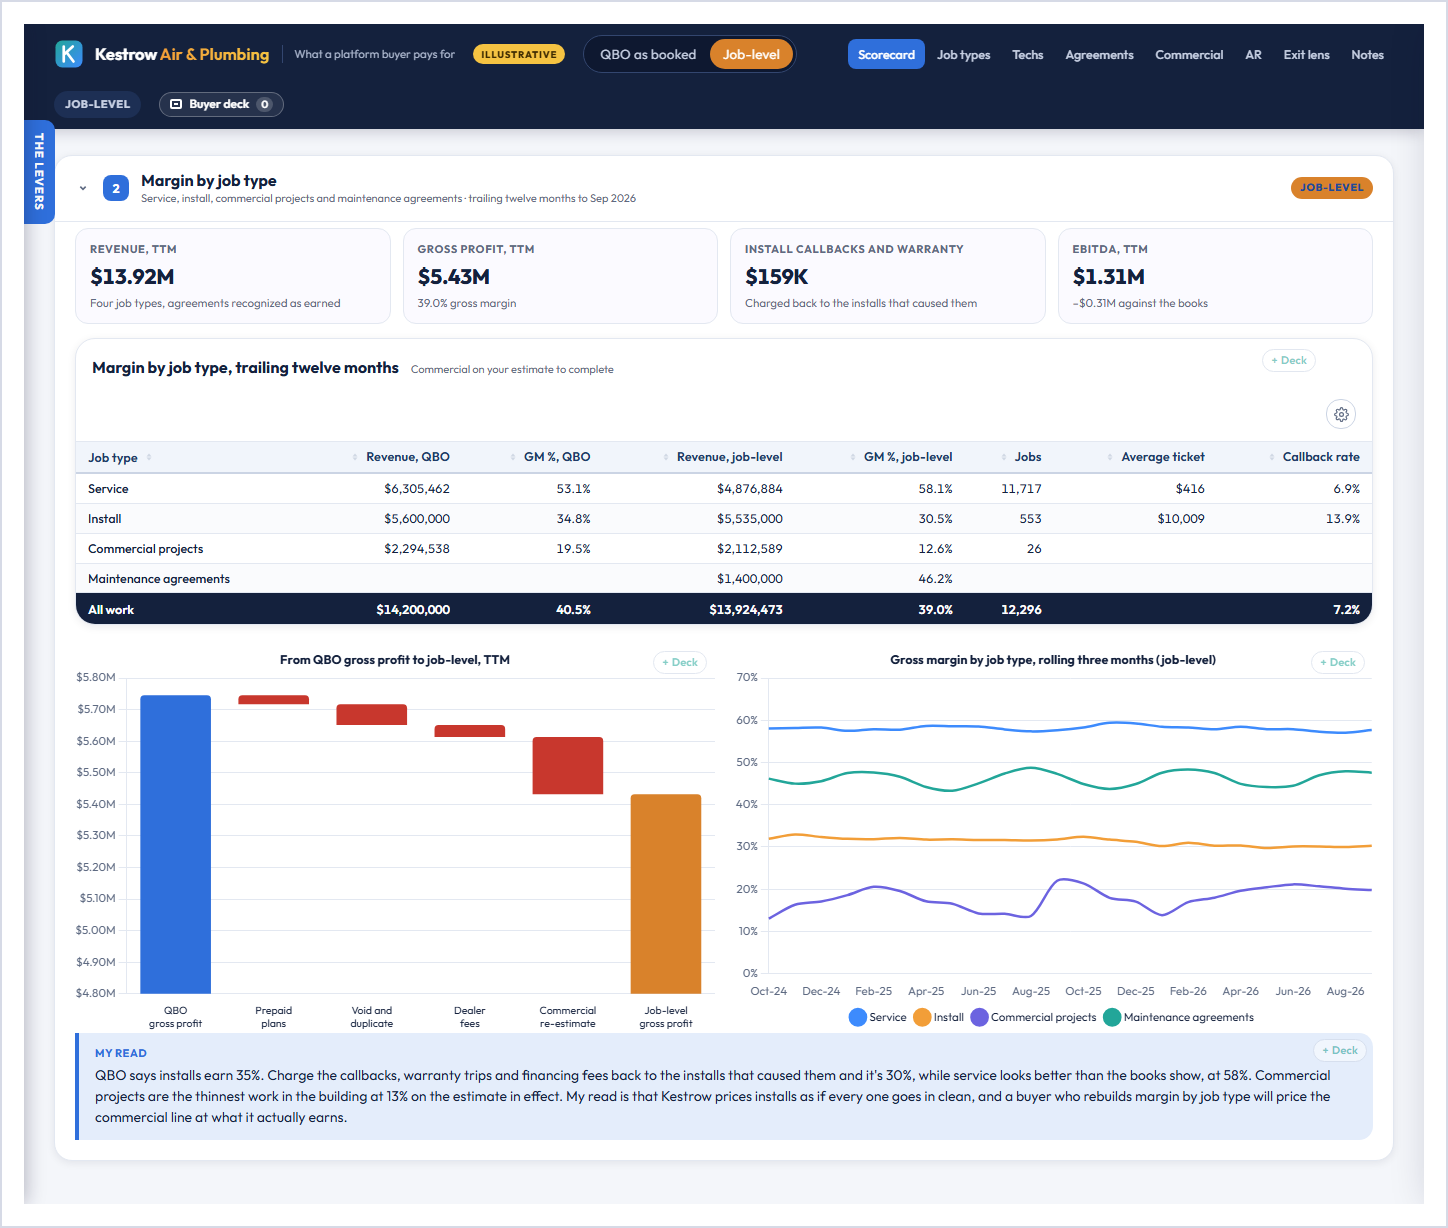
My read: Kestrow prices its installs as if every one goes in clean, and the commercial line is the thinnest work in the building – a buyer will value both at what they actually earn, so the owner should know those numbers first.
Look at the technicians before the trucks
Revenue per billable technician is $392K, which is healthy, so this isn't a productivity problem. The leak is callbacks. 7.2% of service calls and installs come back as a return trip nobody pays for, which cost $308K over the last twelve months. Three service techs account for 42% of the service callbacks while running about 20% of the tickets.
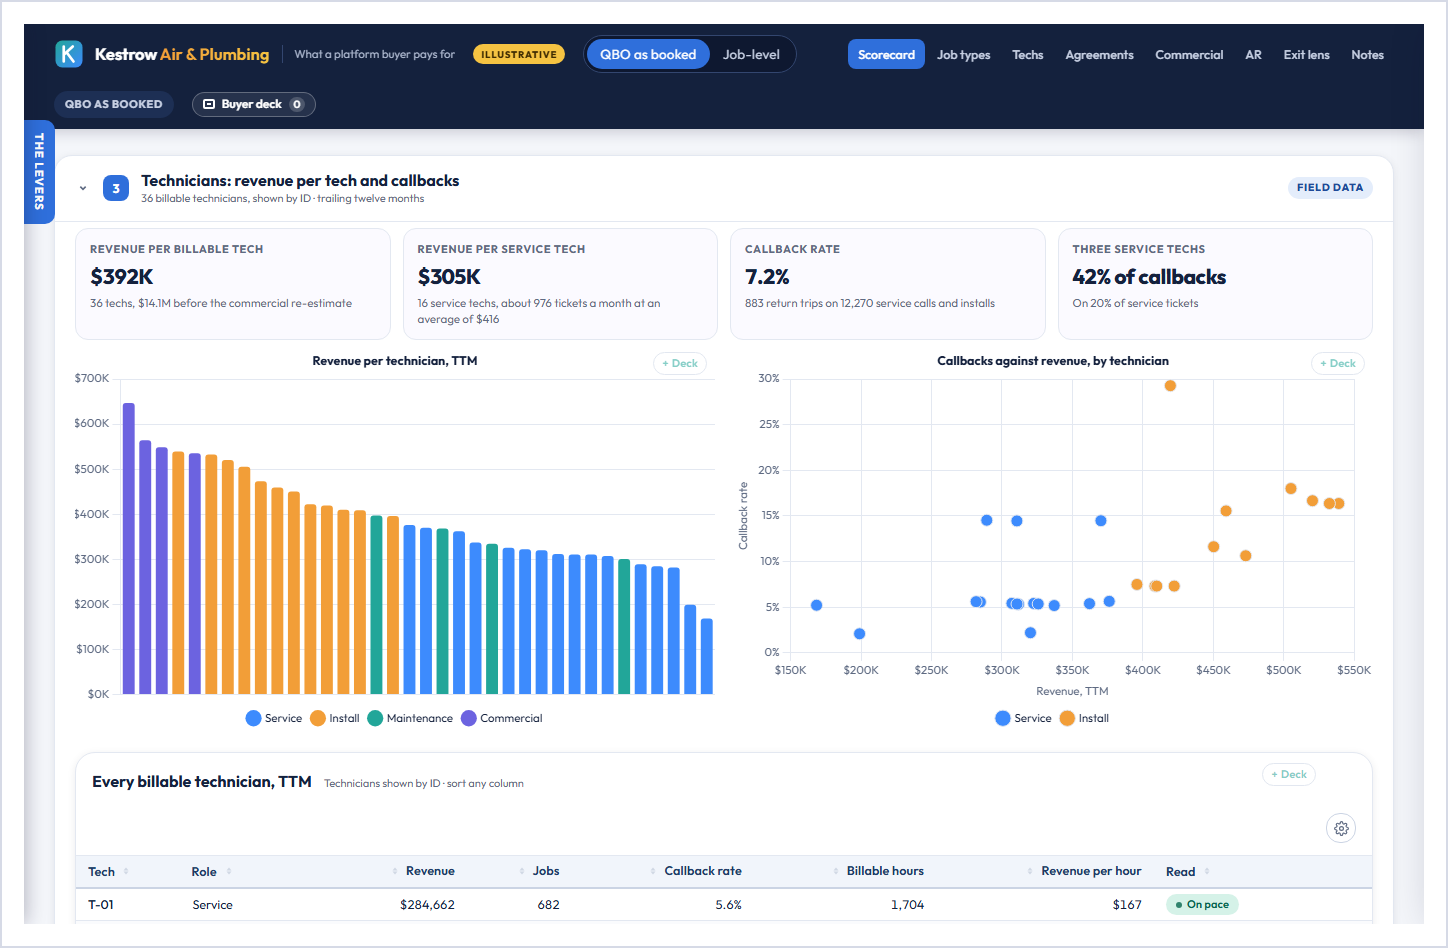
That's a training and ride-along problem with names on it. Getting callbacks to 3.5% is worth about $158K a year, and it frees truck time as well as margin.
My read: before anyone adds a truck, I'd fix who's coming back to the same house twice.
Measure the membership base the way a buyer will
This is the section I'd spend the most time on. Kestrow has 3,850 members. A year ago it had 3,802. About 111 customers join a month and 107 leave, because only 14% of new customers are offered the plan and join, and only 71% of members are still on it twelve months later. The fees came to $1.40M, or 10.1% of revenue.
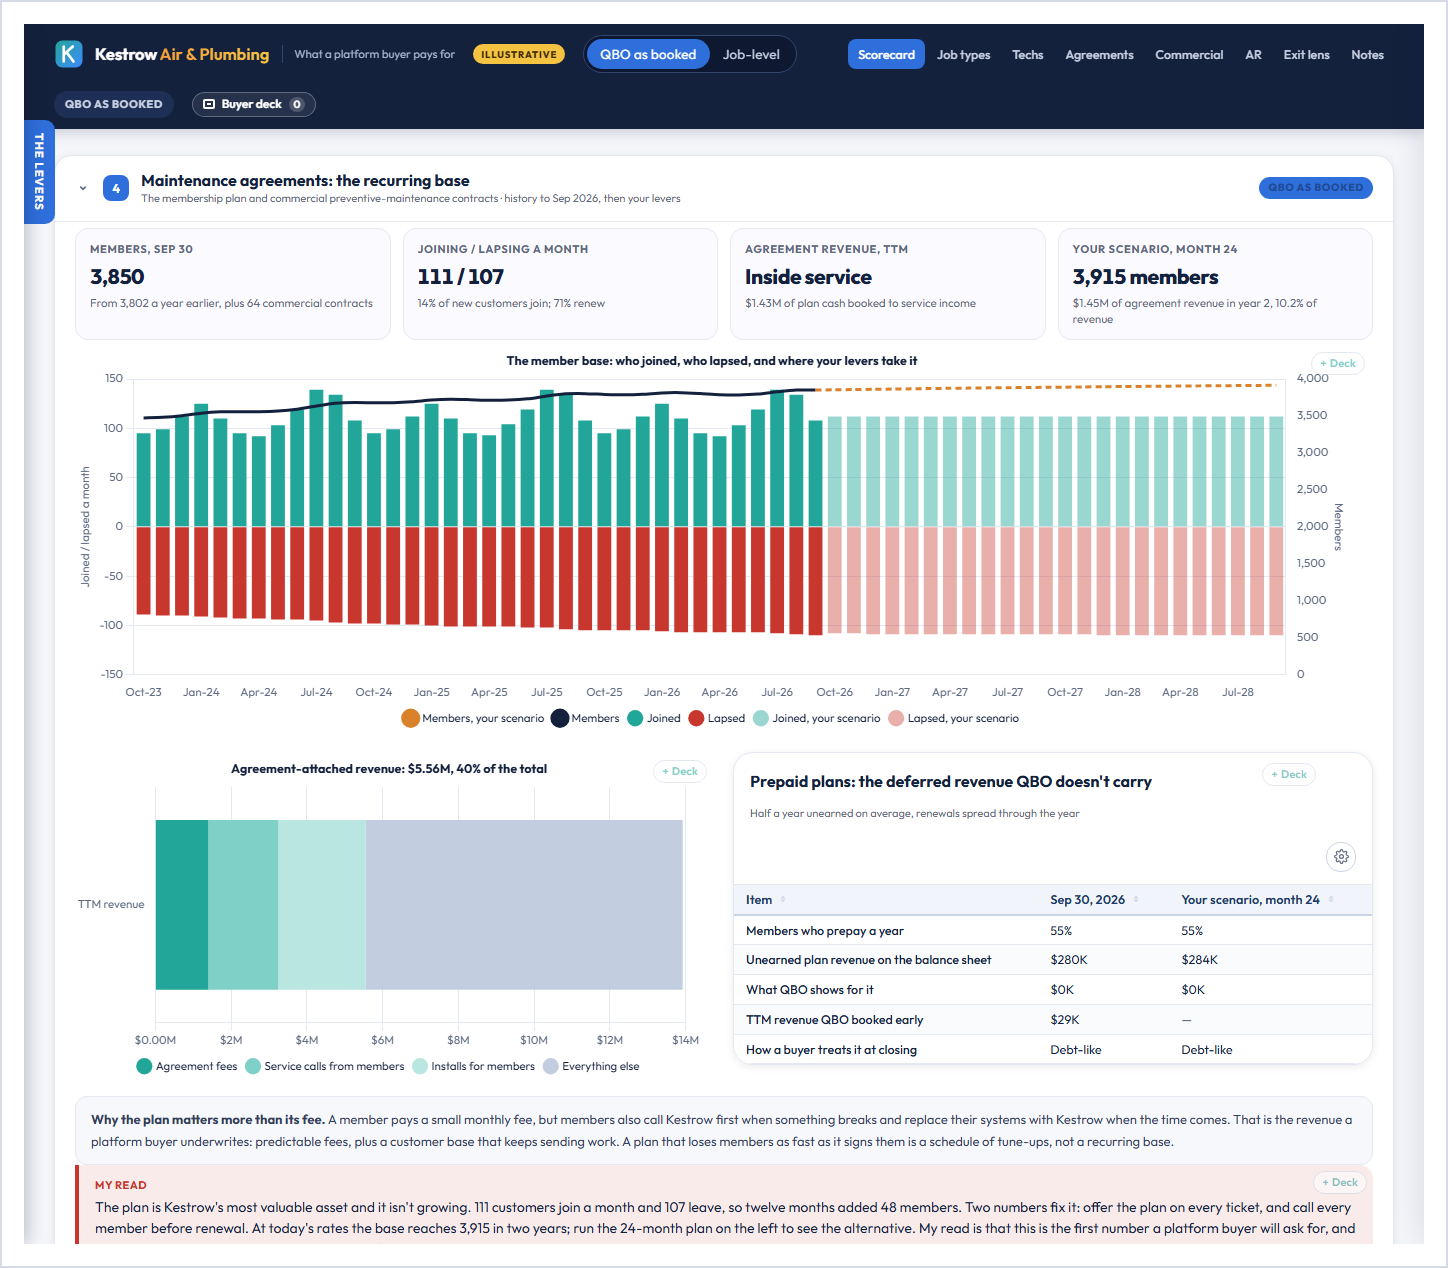
The fee is the smaller part of the story. Members call Kestrow first when something breaks and replace their systems with Kestrow when the time comes. Counting member service calls and member installs, about $5.56M of revenue, or 40% of the business, is attached to the plan. That's the number a platform buyer underwrites, and today QBO can't produce it.
There's a balance-sheet wrinkle too. Annual payers prepay a year, so about $280K of plan revenue is unearned at any point in time. QBO doesn't carry it, and a buyer will treat it as debt at closing.
My read: a plan that loses members as fast as it signs them is a schedule of tune-ups, not a recurring base, and the fix is two habits – offer it on every ticket, and call every member before renewal.
Tie the field software to QBO
The field-service software says customers owe Kestrow $1.42M. QBO says $1.61M. The $190K gap is four ordinary things: $87K of payments techs took on site that were deposited but never applied, $48K of invoices voided in the field but still open in QBO, $38K of financing dealer fees, and $17K of duplicate syncs. The result is that QBO shows 14% of receivables over 90 days when the true figure is 6%.
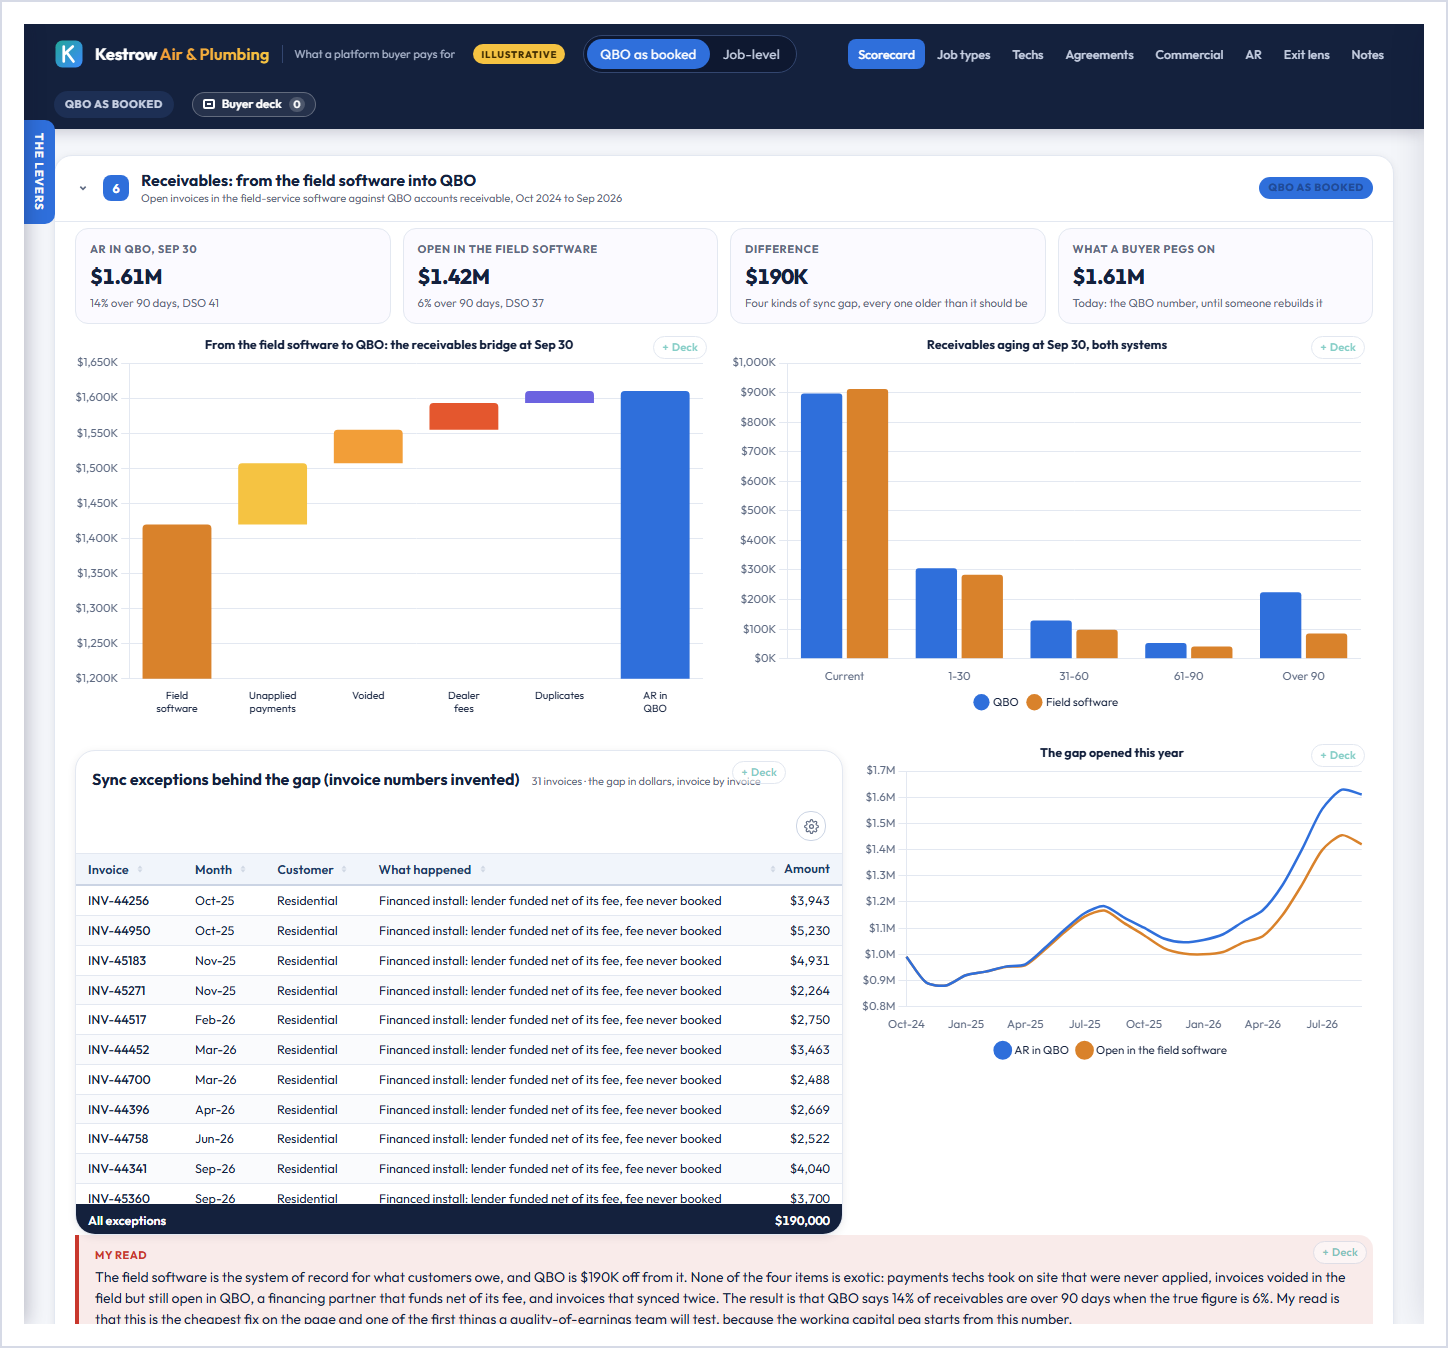
My read: this is the cheapest fix on the page, and it's one of the first things a quality-of-earnings team will test, because the working capital peg starts from this number.
Have the scenario conversation
The exit lens tab is where it comes together. The levers on the left move the next 24 months: attach rate, plan price, renewal, callbacks, techs, job mix, and whether the books get reconciled monthly. The 24-month plan button sets the ones I'd actually work on: 22% attach, a $25 plan, 84% renewal, callbacks at 3.5%, monthly reconciliation, and a membership coordinator at $120K a year.
On those settings the base grows to about 6,300 members, agreement revenue reaches $2.13M (13.7% of revenue), and adjusted EBITDA reaches $2.42M. Enterprise value goes from $7.14M to $14.55M, and pre-tax proceeds go from $5.94M to $13.07M after net debt, the larger deferred revenue balance and deal fees.
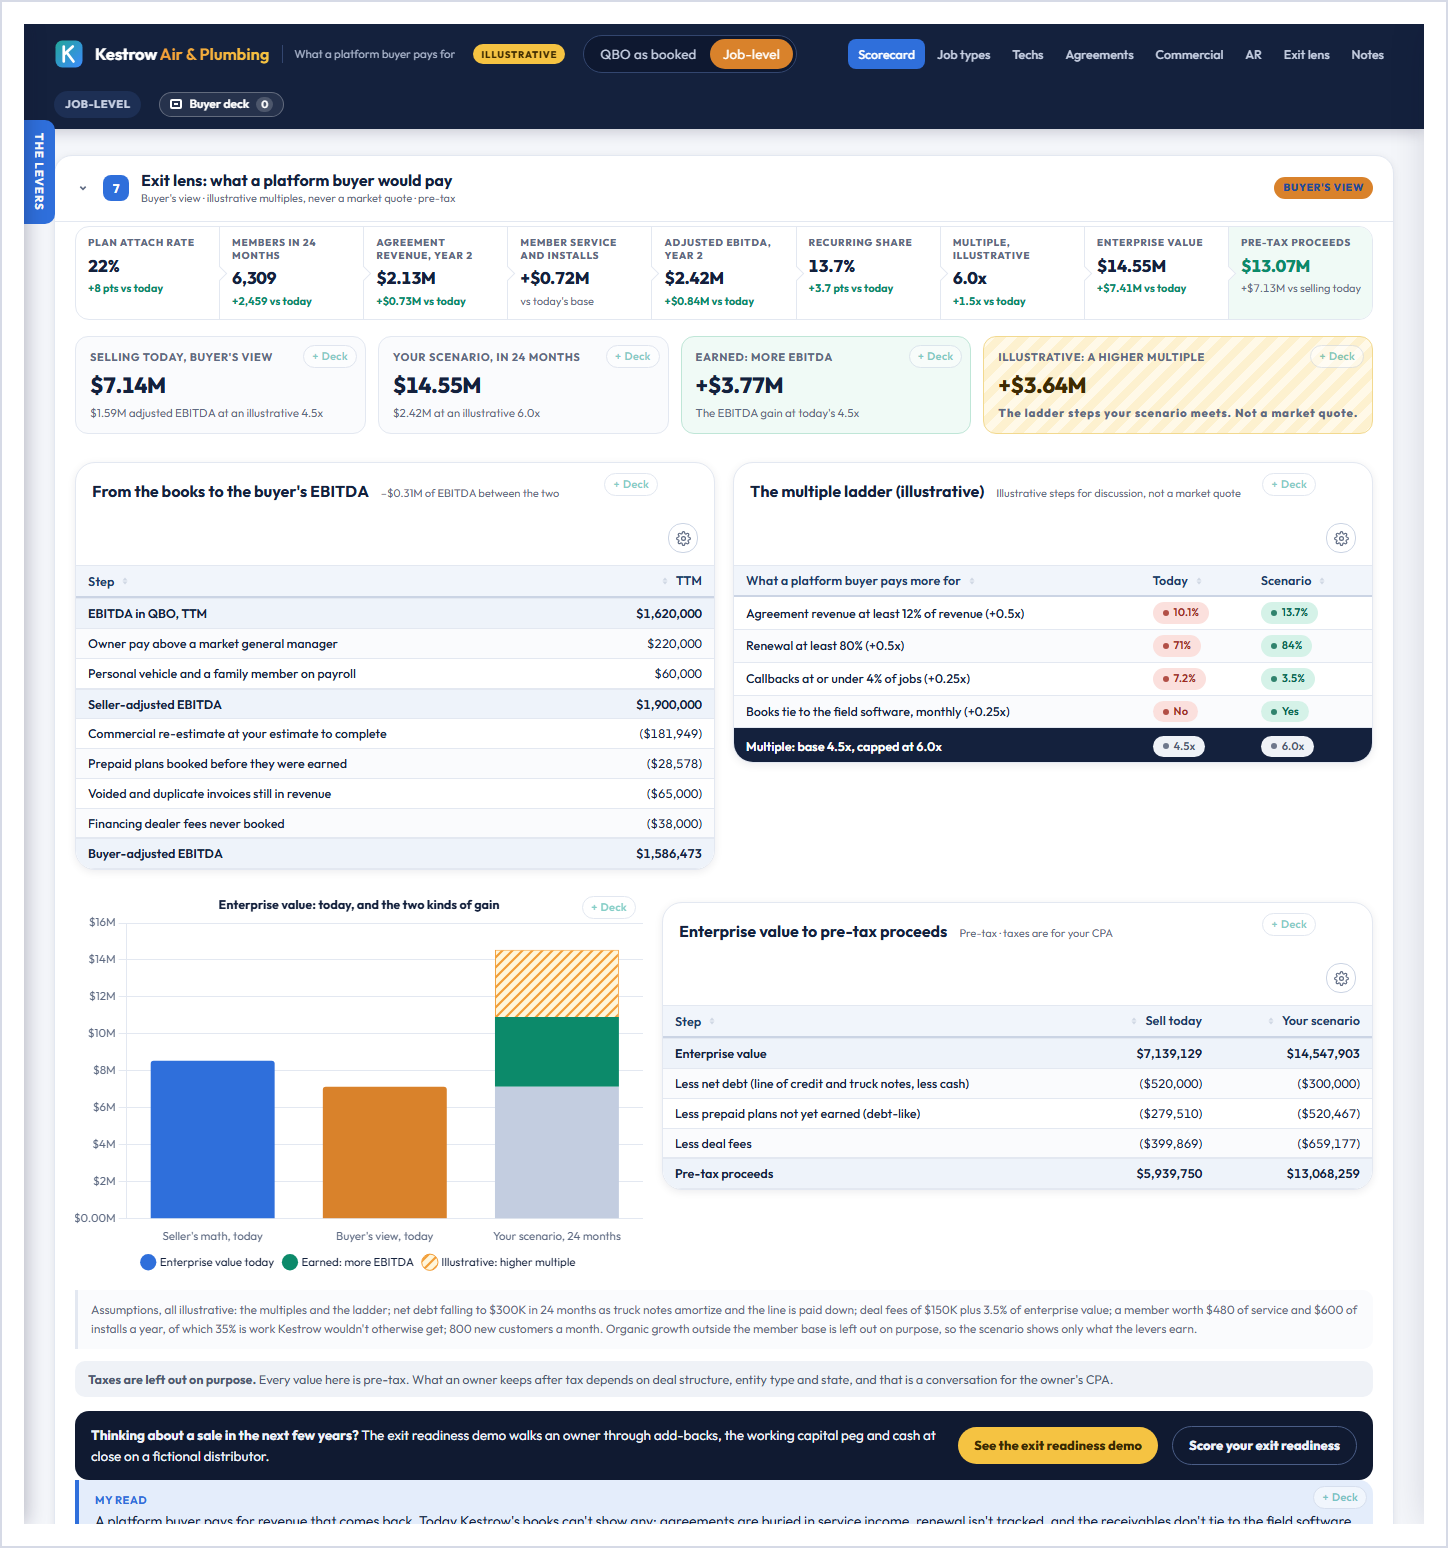
Half of that gain needs a caveat, so the dashboard shows it separately. $3.77M comes from higher EBITDA at today's 4.5x, which is earned. The other $3.64M comes from the multiple moving to an illustrative 6.0x, because the plan meets every step on a simple ladder: recurring revenue above 12%, renewal above 80%, callbacks under 4% and books that tie. Those steps are illustrative and every buyer weighs them differently. Taxes are left out on purpose, since after-tax proceeds depend on structure and are a conversation for your CPA.
My read: the earned half justifies the work on its own, and the multiple is upside you don't get to argue for without clean books. If a sale is on the horizon, the exit readiness demo and our transaction readiness guide cover the rest of that conversation, from add-backs to the working capital peg. Our nine things to know before due diligence is a good companion read.
Build the buyer-ready deck
Every card, chart and table on the page has a + Deck button. Use the buyer-ready pack loads the set I'd bring to a first meeting with a platform or a lender: the scorecard, margin by job type, technicians and callbacks, the member base, agreement-attached revenue, the receivables bridge, commercial work in progress and the exit lens, ending on a next-steps slide. It downloads as an editable PowerPoint, and the speaker notes record which view and lever settings were active when you built it.
My read: walking into that first call with your own member numbers already on a slide changes who sets the terms of the conversation.
What it takes to get this on your own numbers
We connect read-only to your accounting system and your field-service software, rebuild margin by job type from the tickets, installs and job costs, and tie your receivables in the field software to QBO every month. Then we measure the membership base the way a buyer will (signups, renewals, revenue per member, agreement-attached revenue) and refresh all of it after every month-end close.
That's CFOptimize – accelerate your growth, built for service owners who want the recurring revenue they've already earned to show up in the numbers, whether or not a sale is on the table. If you'd like to see it on your own books, grab time with me and we'll walk through it together.
Mark
Kestrow Air & Plumbing is a fictional company and every figure in the dashboard and in this post is invented for illustration. Nothing here is drawn from any client's books. Multiples and the multiple ladder are illustrative assumptions, not market quotes, and nothing here is tax, legal or investment advice.
Share