SaaS CEOs and CFOs preparing for a board meeting on a usage-priced revenue model.
How much of the run rate is contracted, where ARR growth came from, and why billings, revenue and cash never match.
A CEO I've known for years pasted their company's P&L into ChatGPT before a board meeting last spring and sent me what came back. It was well written and correct about everything it said. Revenue up, margin flat, cash a little behind revenue in the last quarter, consider monitoring working capital. They read it, nodded, and asked me the question it couldn't answer: why is cash behind, and what do I do about it before the board asks?
That gap is the whole reason this post exists. Any CEO can get a fluent summary of their financials now, in about thirty seconds, for free. What a summary can't do is tell you which customer, which contract term, or which spreadsheet is behind the number, because none of that is in the P&L. It's in the invoice lines, the usage meter, the signed contracts and the CRM, and somebody has to connect those, keep them connected, and know the business well enough to read them.
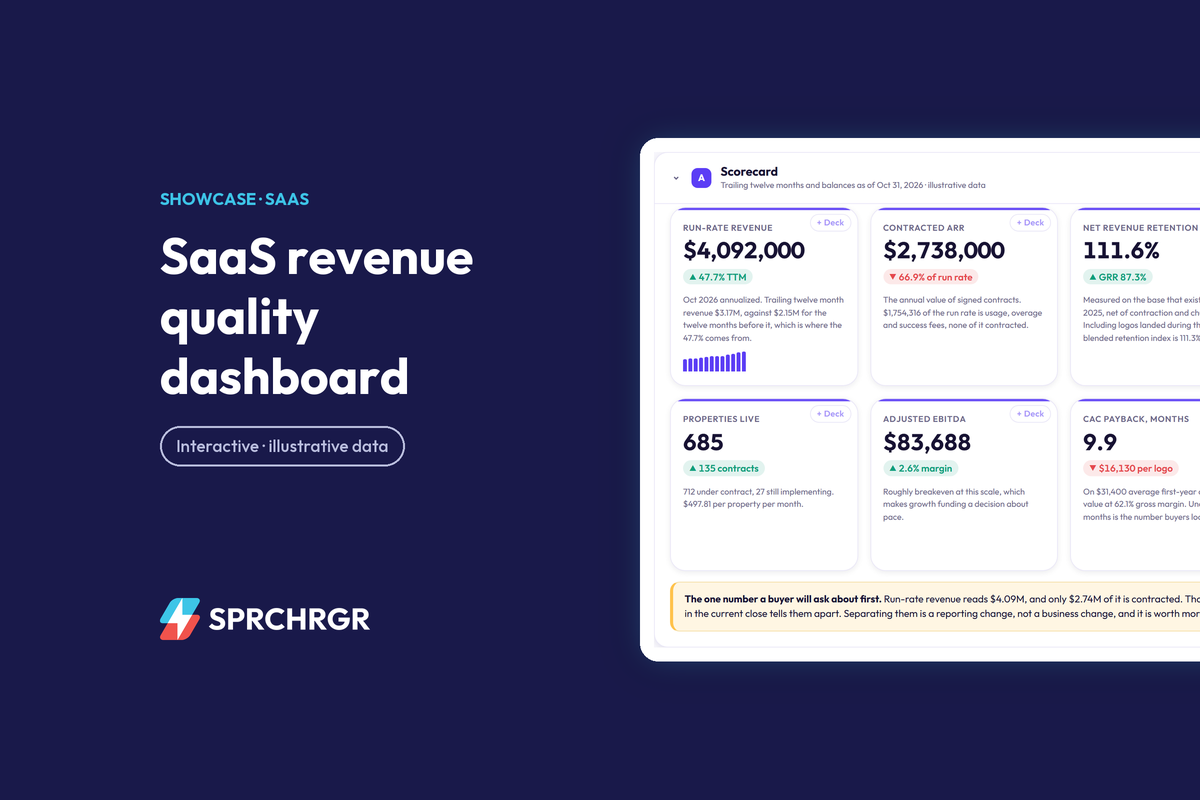
So here's how I'd walk a CEO through a quarter using a working sample dashboard we built for a fictional hospitality-software company called Halvanta. The company, the customers and the numbers are invented. The patterns aren't; I've seen every one of them in real books. Open it in another tab and follow along.
The quarter in three sentences
This is the paragraph at the top of the page, and it's the one I'd want the CEO able to say out loud to a board member without looking down:
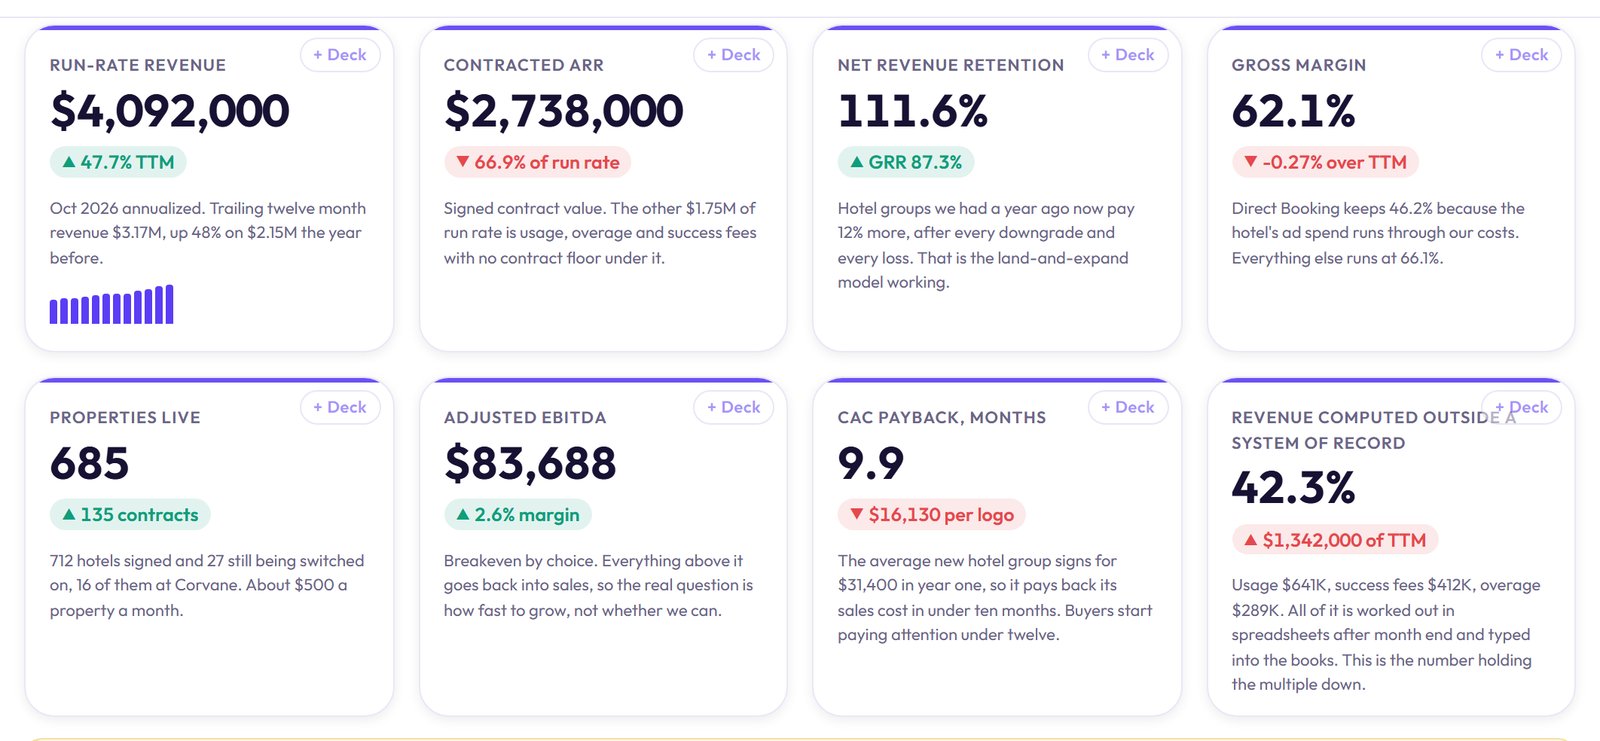
Best quarter yet, and the first one where growth cost us cash. We earned $961K from August through October, 18% more than the summer, and every product line grew at least 14%. But our fastest-growing revenue is earned weeks before we're allowed to bill it, so we collected $91K less than we earned, and we're fixing that in the contracts before next renewal season.
Notice what's in it. There's a number people will remember, a problem stated before anyone else finds it, and a decision already made. An AI summary of the same P&L gets the first sentence right. The second and third need the layer underneath.
Why cash fell behind, at the level you can act on
Read from the P&L, Halvanta's cash problem looks like a timing issue, and the generic advice is to watch working capital. Read from the transactions, it's specific. Halvanta sells success-fee contracts: the hotel group pays a share of the bookings our product generates. Halvanta can't invoice until the hotel sends its monthly production report, and when we lined up report dates against invoice dates, those reports were arriving 38 days after month end on average. $122K was sitting earned and unbilled for that reason alone.
Nobody on Halvanta's team would call that a finance problem, and it lives in the commercial terms. A ten-day reporting deadline in the next round of renewals fixes most of it. Billing usage straight from the meter on the 1st, instead of after an 11-day close, pulls another $40K or so of cash forward. Neither of those shows up in a summary of the financial statements.
Key accounts moving ARR
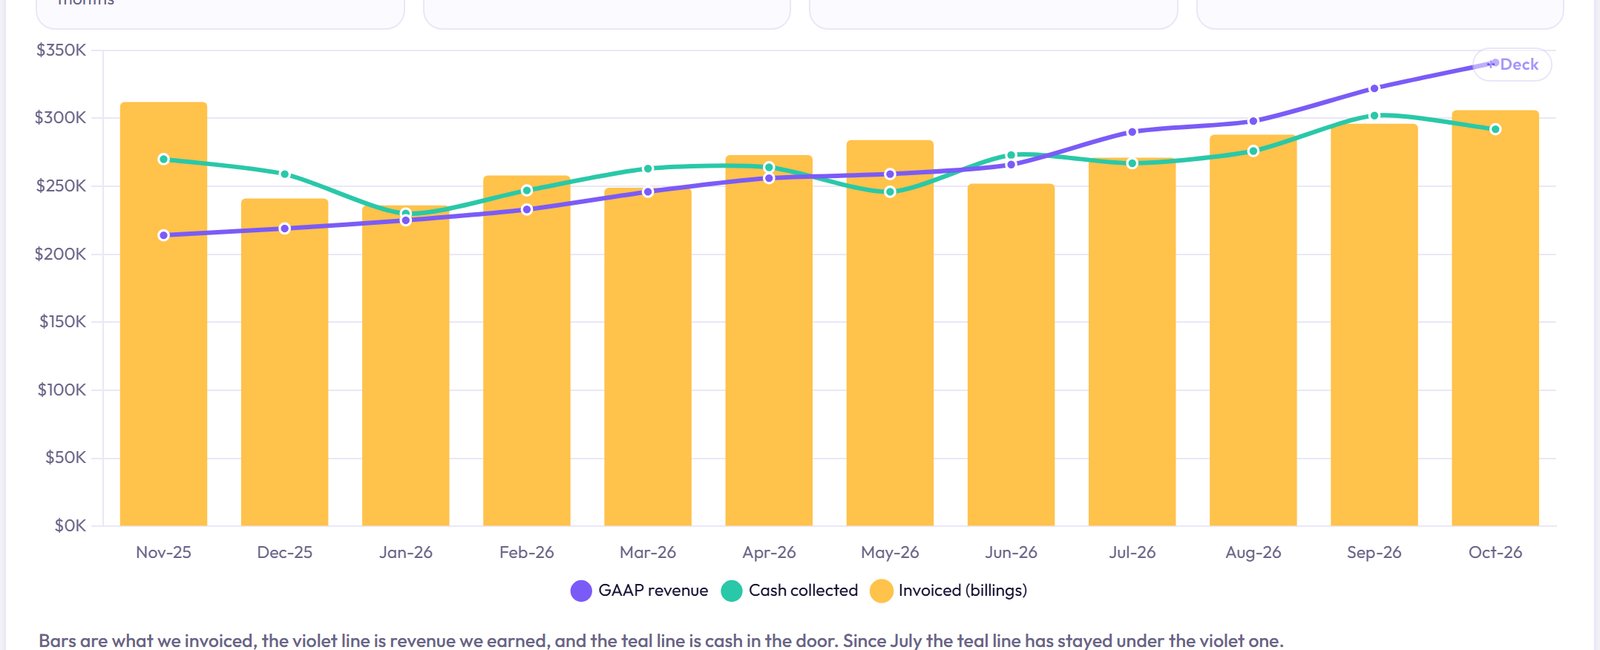
Every board member hears "net revenue retention of 112%" and asks the same follow-up: who? So the ARR bridge on the page has a table under it with the accounts that actually moved the year.
- Sandreth Hospitality took the AI contact center from a 9-hotel pilot to all 31 properties. That was $74K of new ARR with no sales cycle, and it's the path every pilot should be on.
- Tessaly Resorts signed in September as the biggest new logo of the year and is still switching on 16 of its 18 hotels. That ramp is part of why signed ARR runs about $400K ahead of what's live.
- Avery & Stroud was the largest loss, and here's the part that only came from the CRM: six of the eleven groups Halvanta lost were sold to new owners who run their own call centers. That's not a service failure. It is predictable, though, and the fix is a CRM flag on pending ownership changes plus a change-of-control clause in new contracts.
That last point is the one I'd want a CEO to take into the room. "We lost eleven customers" invites a debate about product. "Six of them were acquired, and here's what we changed" ends it.
The question a buyer asks first
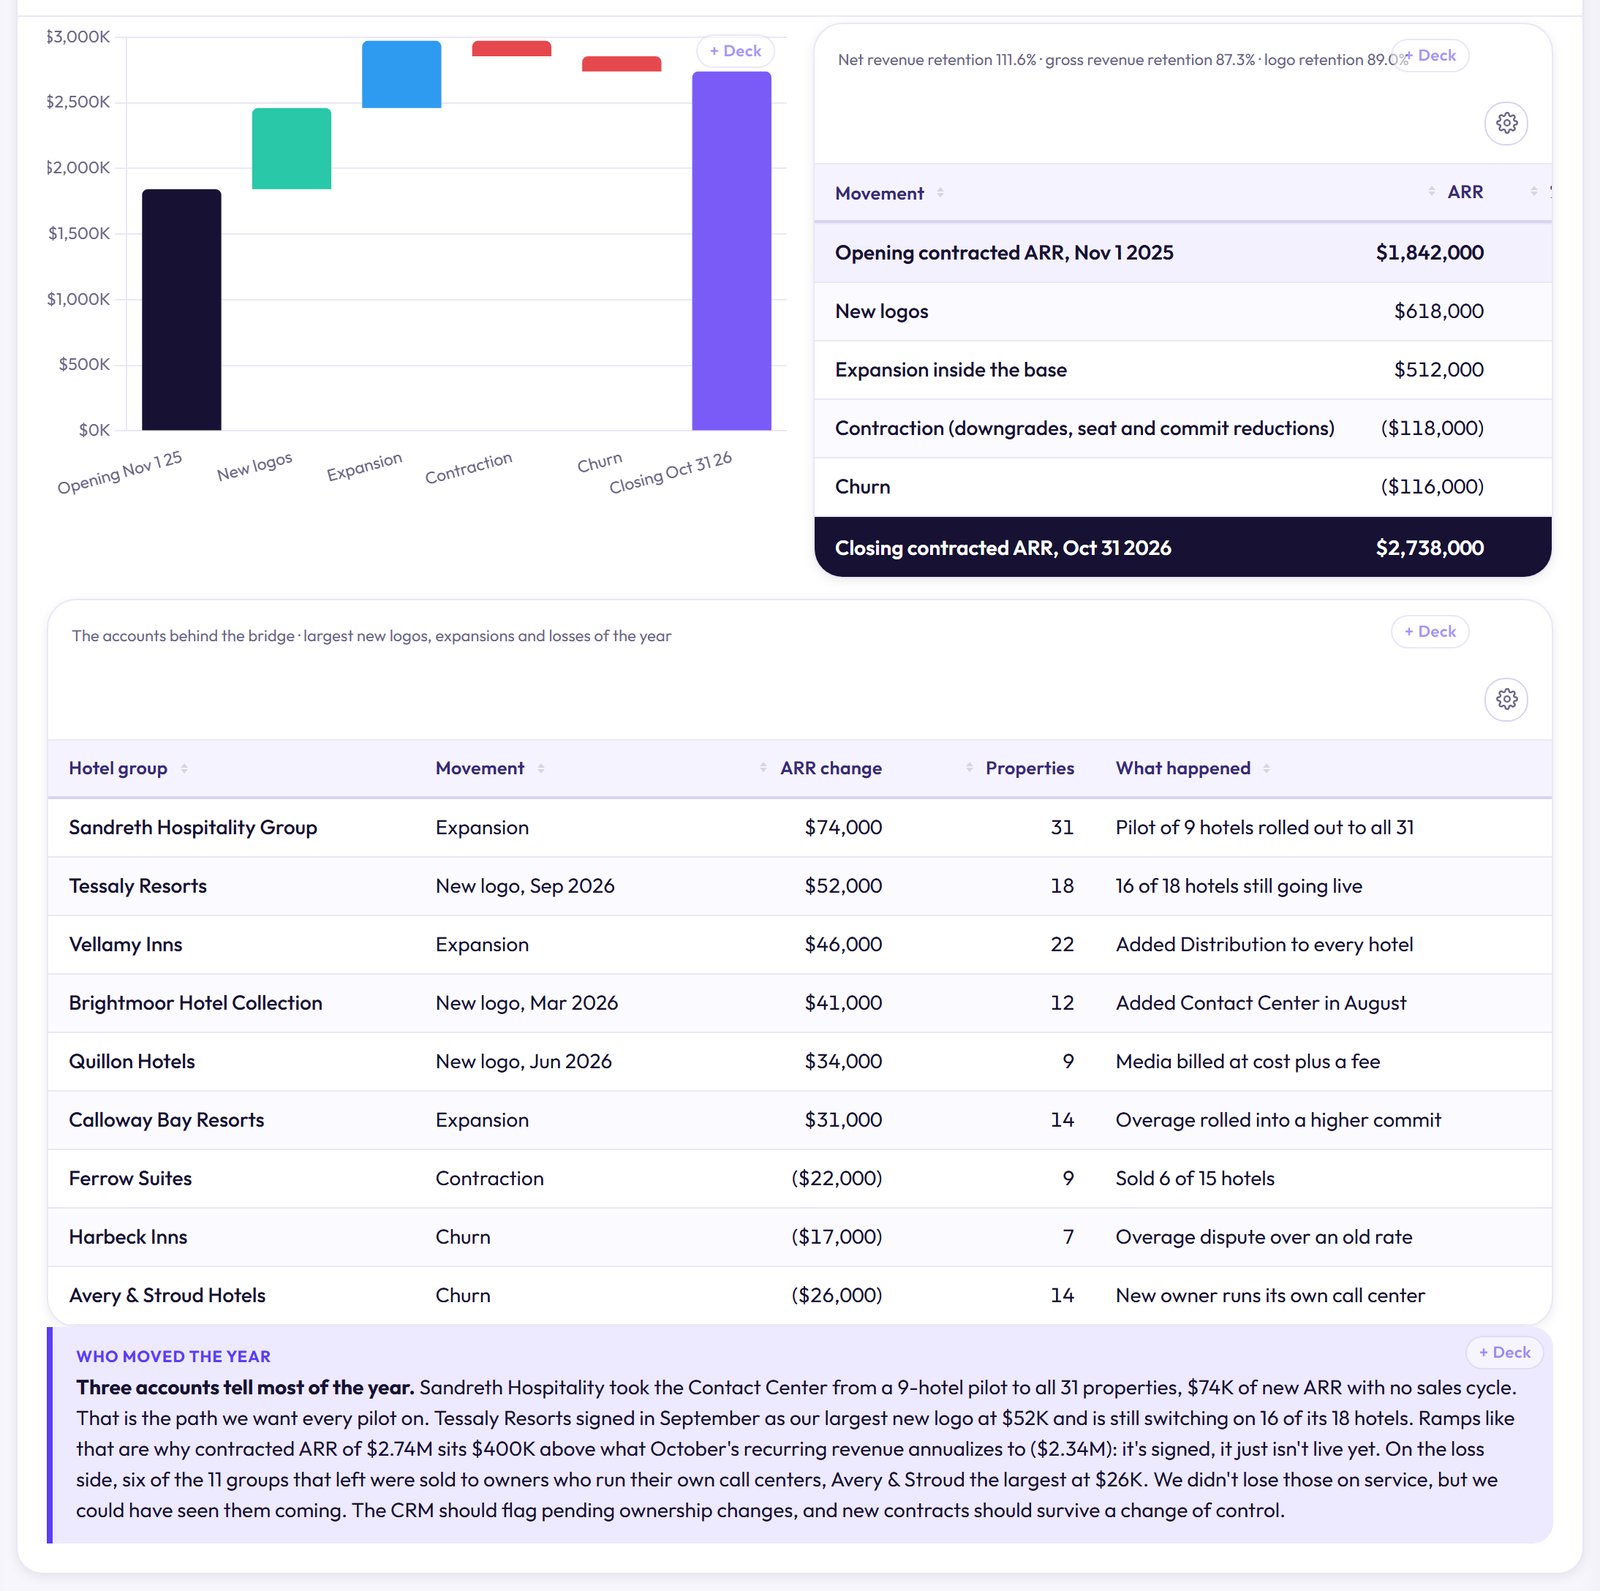
Halvanta's run rate is $4.09M and $2.74M of it is under contract. The other third is usage, overage and success fees: real revenue, collected in cash, and priced by any buyer as though it might not repeat. Today it takes Halvanta a week of spreadsheets to even say how big each layer is.
The useful move here came from one account. Calloway Bay's overage ran well past its commitment for three straight quarters, so at renewal the commitment was rewritten and $31K moved from "usage" to "contracted" overnight. Same customer, same revenue, better multiple. The ten heaviest overage accounts are worth the same conversation, and they could take Halvanta's contracted share past 70% without signing anyone new.
What the close is really costing
Halvanta takes 19 business days to close a month, and 94% of the manual work comes from three contract types where someone opens the signed contract, finds the rate and types it into a spreadsheet. When we matched those spreadsheets to the contract files, 19 rates no longer agreed with the latest signed amendment. One of them was billing Harbeck Inns at an old overage rate, and Harbeck left after three months of disputed invoices. $11K of that dispute is still sitting in receivables past 90 days.
That's the cost of a slow close nobody budgets for. Put every contract's terms in one table that billing and revenue both read from, and the close drops toward five to seven days, the disputes stop being created, and diligence gets a clean answer on the first ask.
The scenarios and the board deck
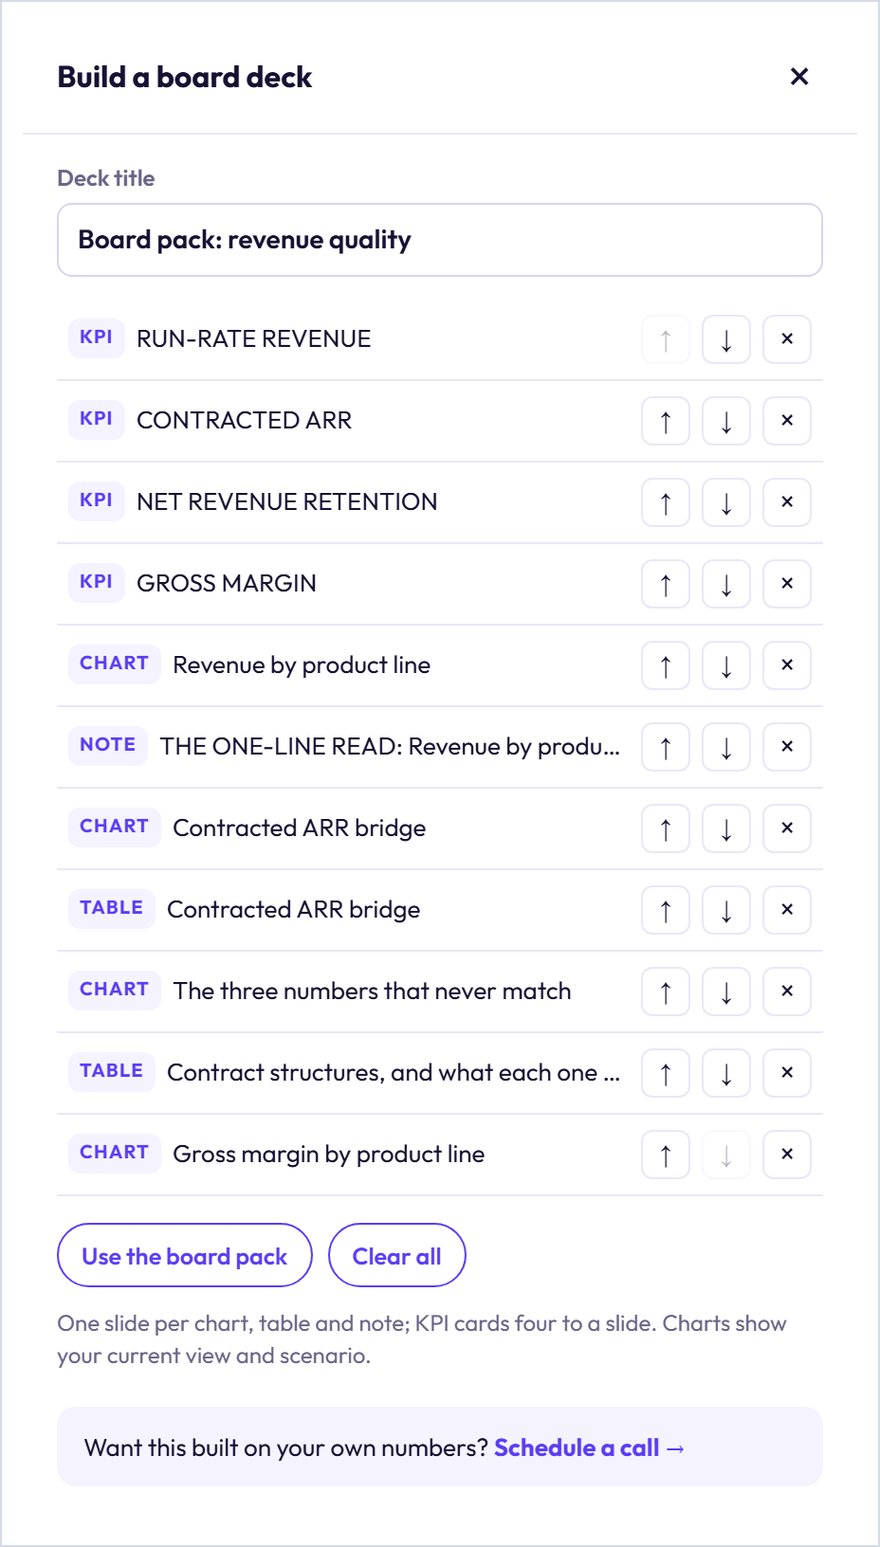
The scenario drivers on the left of the page move the six-month forecast while the twelve closed months stay locked. If the board wants to see churn at twice today's rate, slide it and every forward number updates, with the base case still on the chart for comparison. Every card, chart and table also has a + Deck button, so the pieces you want in front of the board drop into an editable PowerPoint, with speaker notes, in a couple of minutes.
Why not just do this yourself with AI?
You can do a lot of it yourself, and you should use AI. We use it every day. The honest answer is that the analysis was never the hard part. Every insight above came from four things a chatbot doesn't have:
- Transaction-level data, kept current. Invoice lines, meter readings, payments and contract terms, pulled automatically from the accounting system, billing platform and CRM after every close, and reconciled so the numbers tie to the books.
- Context nobody wrote down. That success-fee reports run late, that a customer was just acquired, that an amendment changed a rate. We add that to the data so it shows up next to the numbers it explains.
- Somewhere safe to keep it. Read-only connections, a secured warehouse, and access controls, instead of customer contracts and payroll files pasted into a chat window.
- Someone accountable for it. A CFO who knows your business well enough to say "that's not a churn problem, that's an M&A pattern" and then change the contract template.
Put those in place and the AI gets a lot more useful too, because it's finally reading the right data.
What it takes to get this on your own numbers
Nothing on this page needs special software on your side. We connect read-only to QuickBooks Online (or your ERP), your billing system and your CRM, rebuild the last twelve months on one consistent basis, and put each contract's terms in one table that billing and revenue both read. From then on the dashboard refreshes after every close, and the paragraph at the top gets written by someone who knows why the numbers moved.
If you'd like to see that on your own books, schedule a call with our team. You can also browse the other demos in our showcase.
Halvanta and every customer named in this post are fictional, and every figure is invented for illustration. Nothing here is drawn from any client's books.
Share