Owners of $5 to 25M HVAC, plumbing and home-service companies who've started getting calls from private-equity-backed platforms, and the business brokers, CPAs and bankers who advise them.
What margin each type of work really earns, whether the membership plan is a recurring base or a tune-up schedule, why the receivables in QBO don't match the field software, and what all of that does to the price a buyer will pay.
The founder of an HVAC and plumbing shop called me on a Monday morning after a record summer. Two private-equity-backed platforms had left messages the same week, and the question was simple: what's my business worth, and what should I fix before I call them back?
An AI tool will give you a tidy answer to that in thirty seconds. Paste in the P&L and it'll tell you revenue is up, margins are decent, and HVAC businesses trade at some multiple of EBITDA. What it can't tell you is what a platform's quality-of-earnings team will find when it rebuilds your year from the field-service software, or which of your technicians and members the price really depends on. That's all in the tickets, the job costs, the membership file and payroll, and somebody has to connect them.
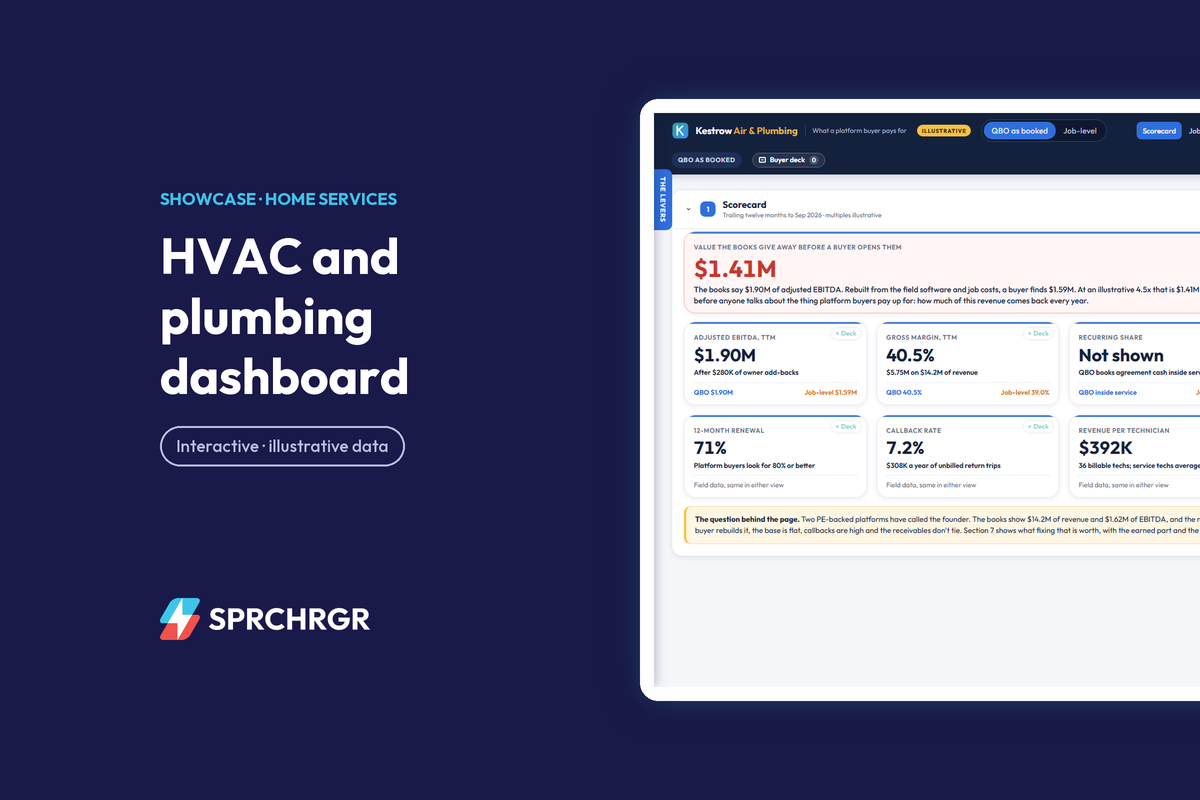
So here's how I'd walk that founder through it, using a working sample dashboard we built for a fictional company called Kestrow Air & Plumbing. The company, the projects and the numbers are invented. The patterns aren't; I've seen each of them in real books. Open it in another tab and follow along.
The quarter in three sentences
This is the paragraph at the top of the page, the one I'd want the owner able to say on that first call:
Revenue was $4.3M from July through September, 30% more than last summer, and the books show $630K of EBITDA for the quarter. A buyer rebuilding the year from the field software finds $1.59M of adjusted EBITDA, not the $1.90M the books support. The asset that sets the price is the membership plan, it has sat near 3,850 members for a year, and getting sign-ups and renewals up adds about $3.8M of value from earned EBITDA alone.
A summary of the P&L gets the first sentence. The second needs every ticket, void and lender payment matched between two systems. The third needs someone who knows what a platform buyer underwrites.
Where the $310K of EBITDA went
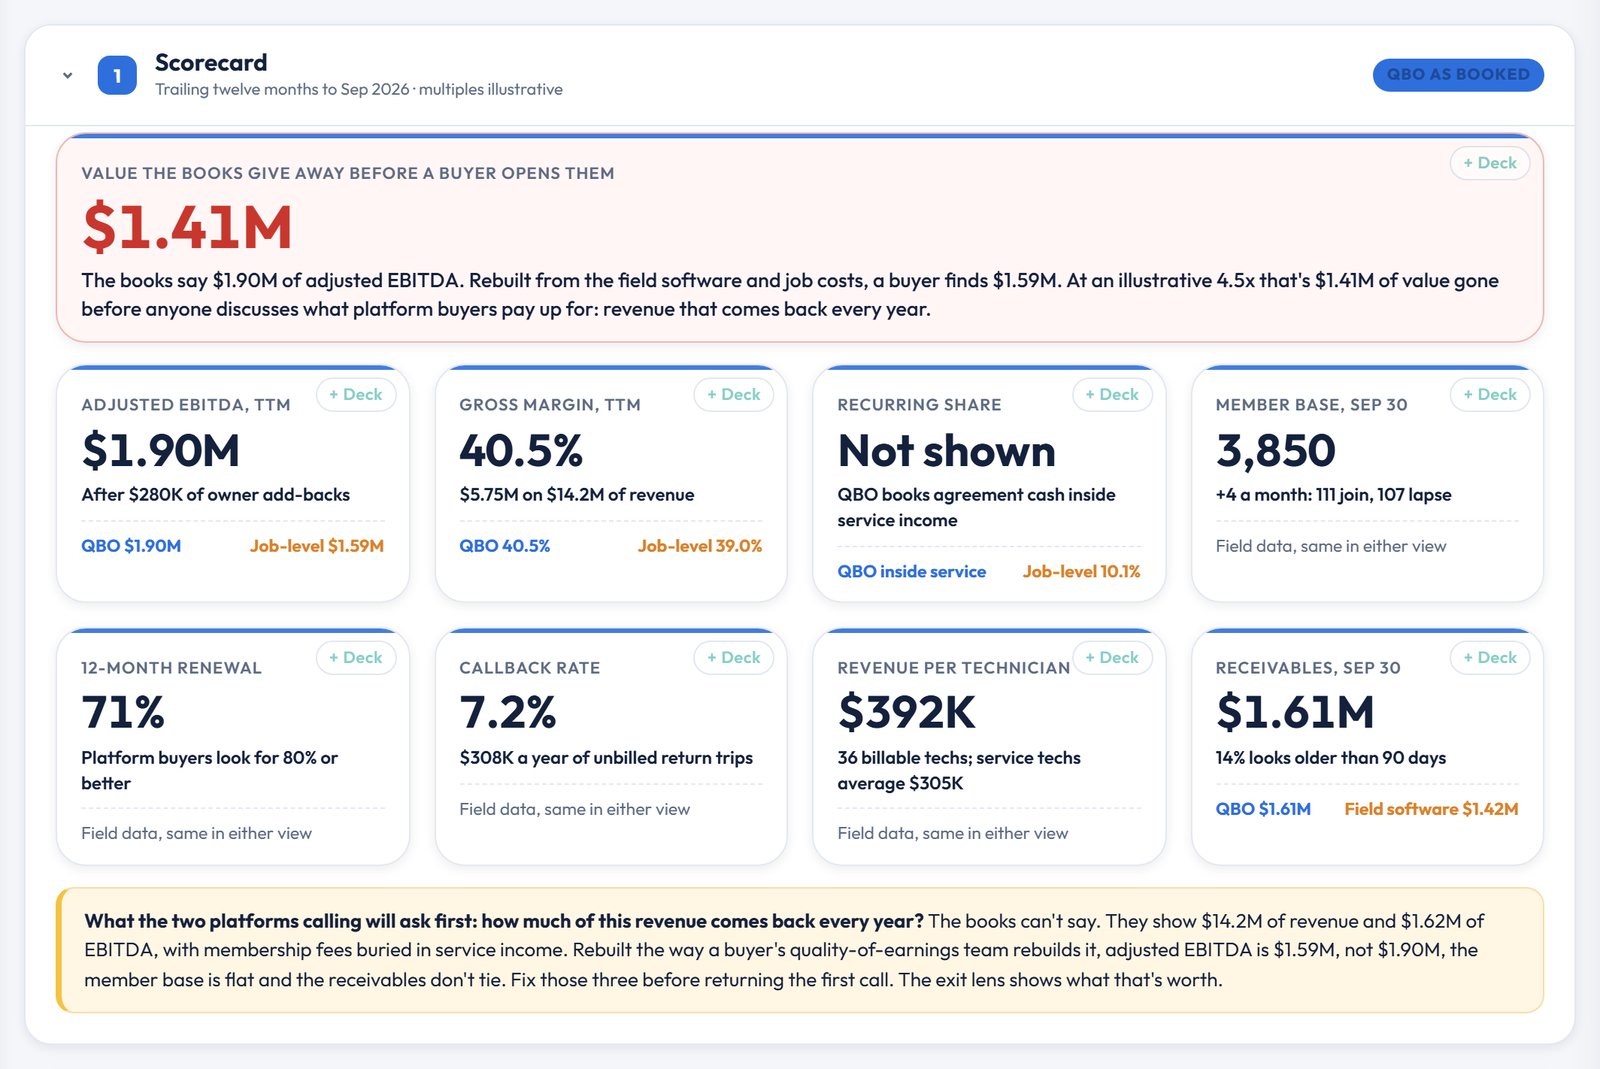
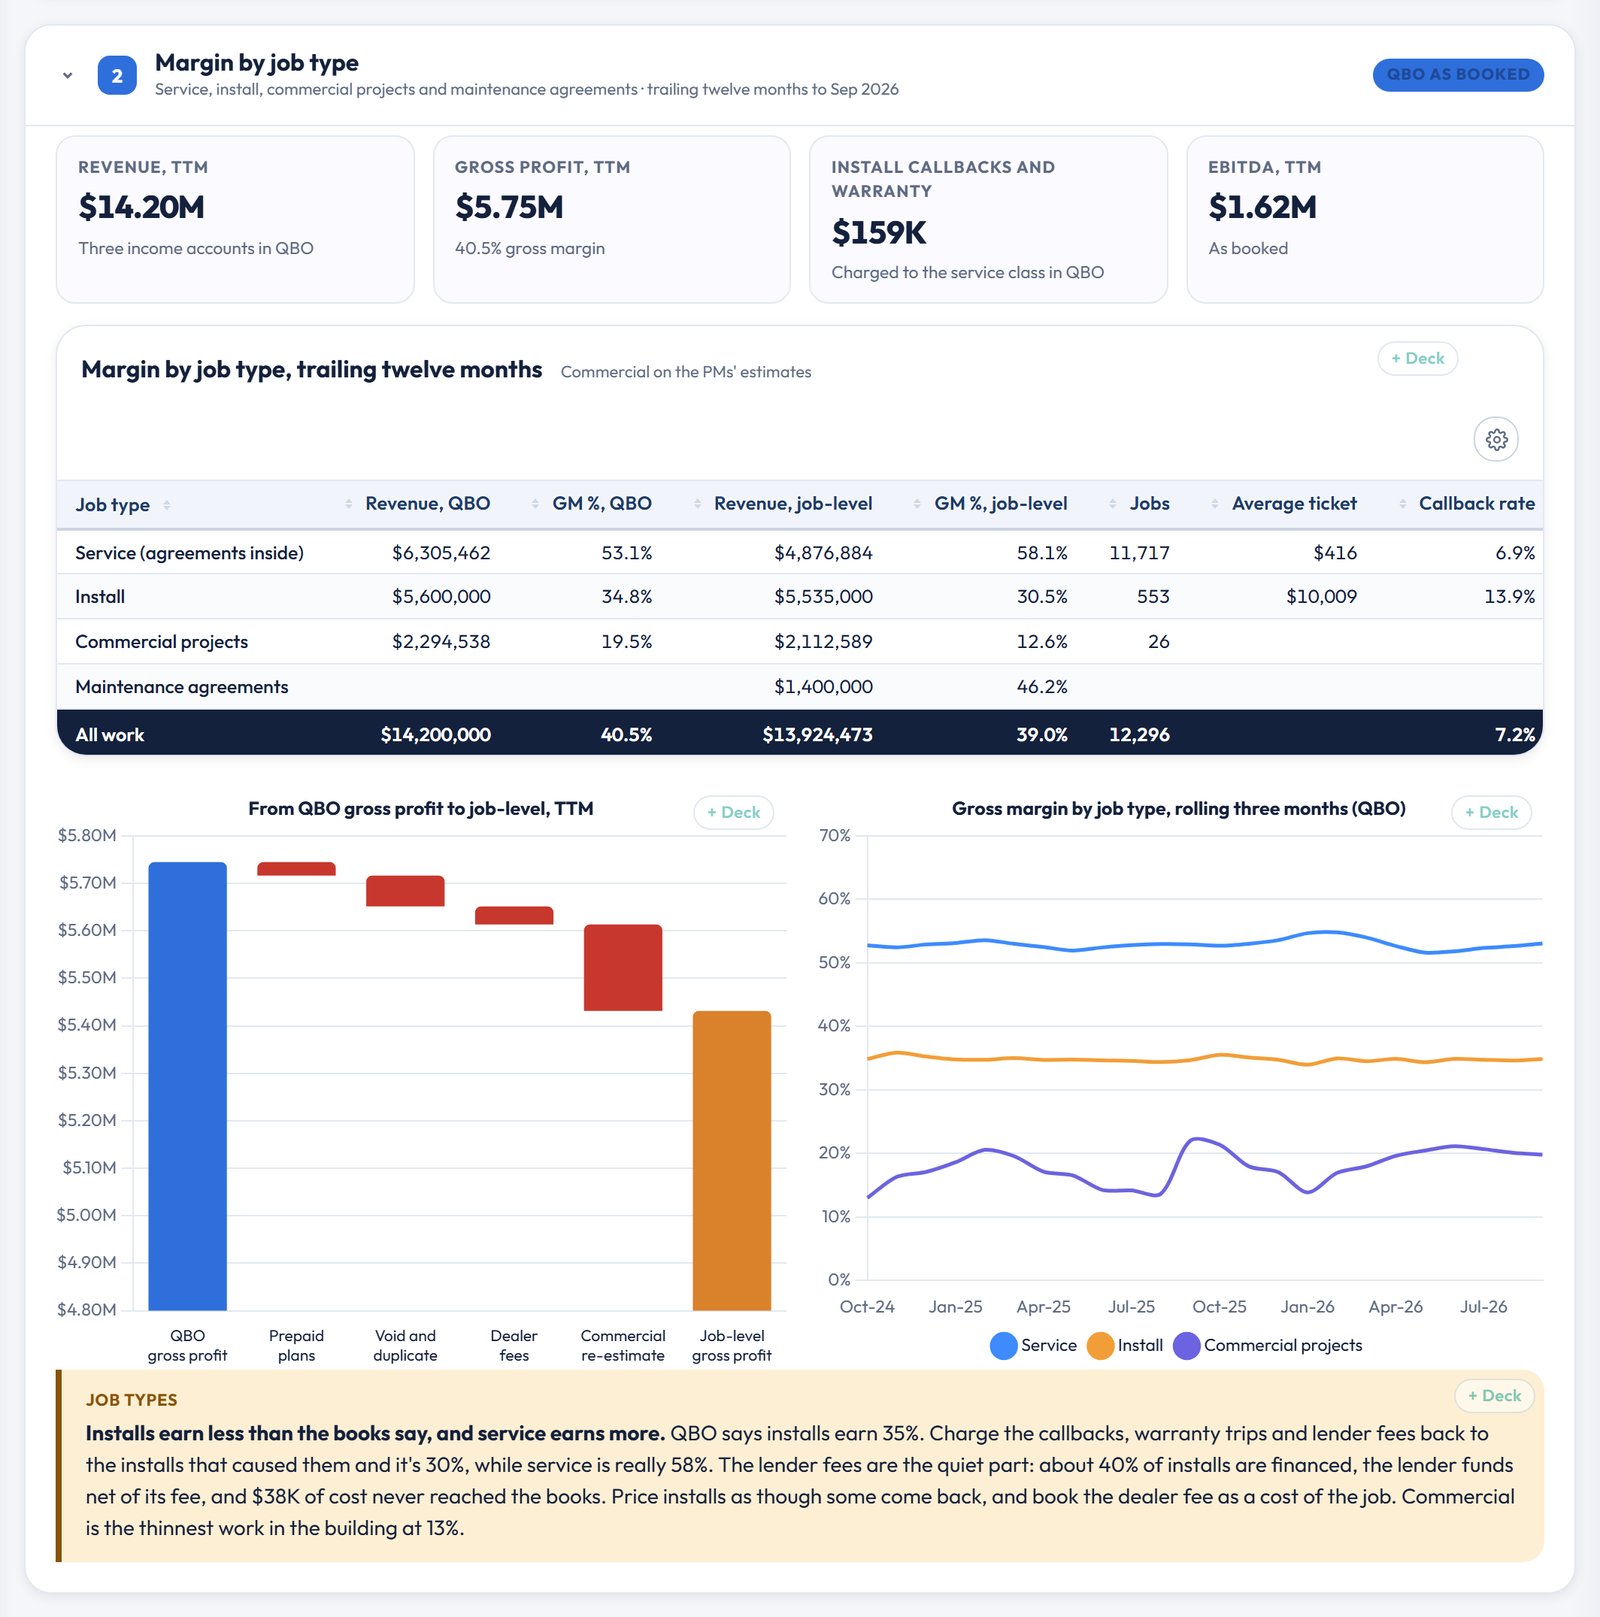
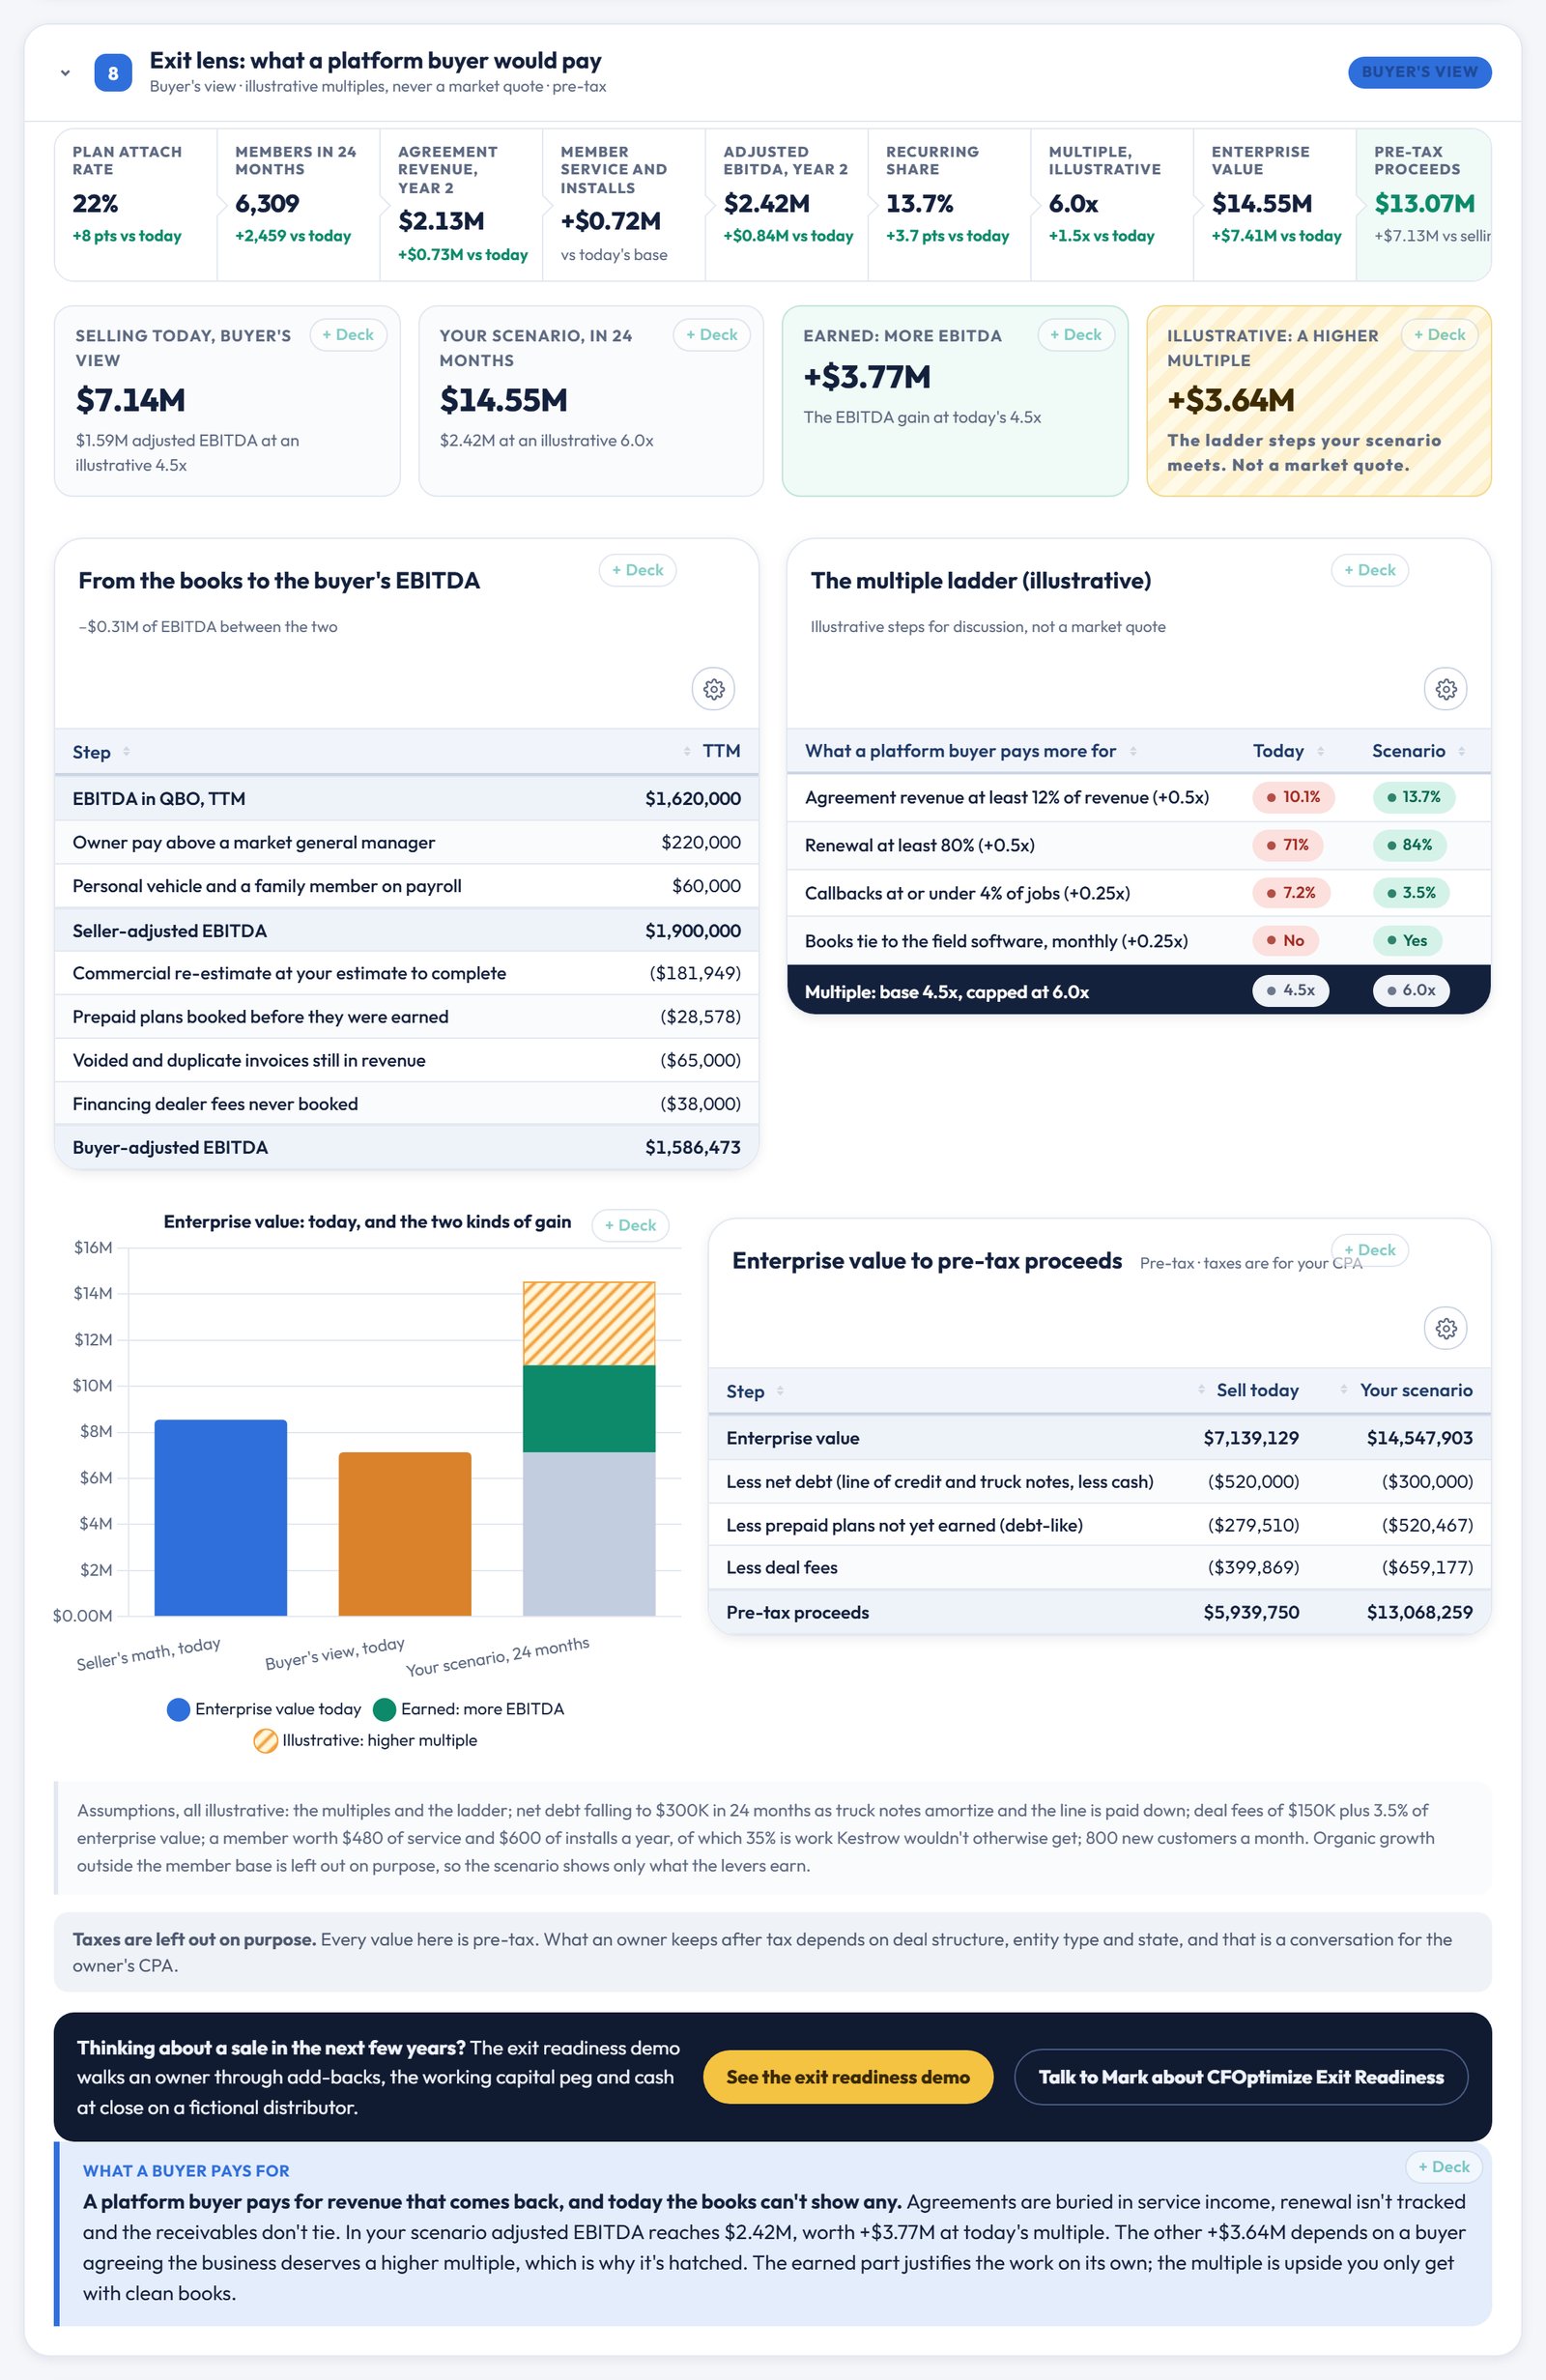
On the books Kestrow made $1.62M of EBITDA, or $1.90M after adding back the owner's pay above a market general manager and a personal vehicle. Rebuilt from the field data, four things come out. Two commercial retrofits, Larkspur Medical Plaza and Hollyvale Senior Living, are running ahead of their estimates, and re-estimated at the cost they've actually run, $182K of gross profit comes back out. Invoices voided in the field are still open in QBO, along with some that synced twice, which is $65K of revenue that never happened. The lender that finances 40% of installs funds net of its fee, and nobody booked $38K of fees. Annual plans were booked as revenue when the cash arrived.
That leaves $1.59M. At an illustrative 4.5x, the difference is $1.41M of value gone before anyone discusses what makes a service business worth more. None of those items is big on its own. A buyer who finds four of them assumes there's a fifth.
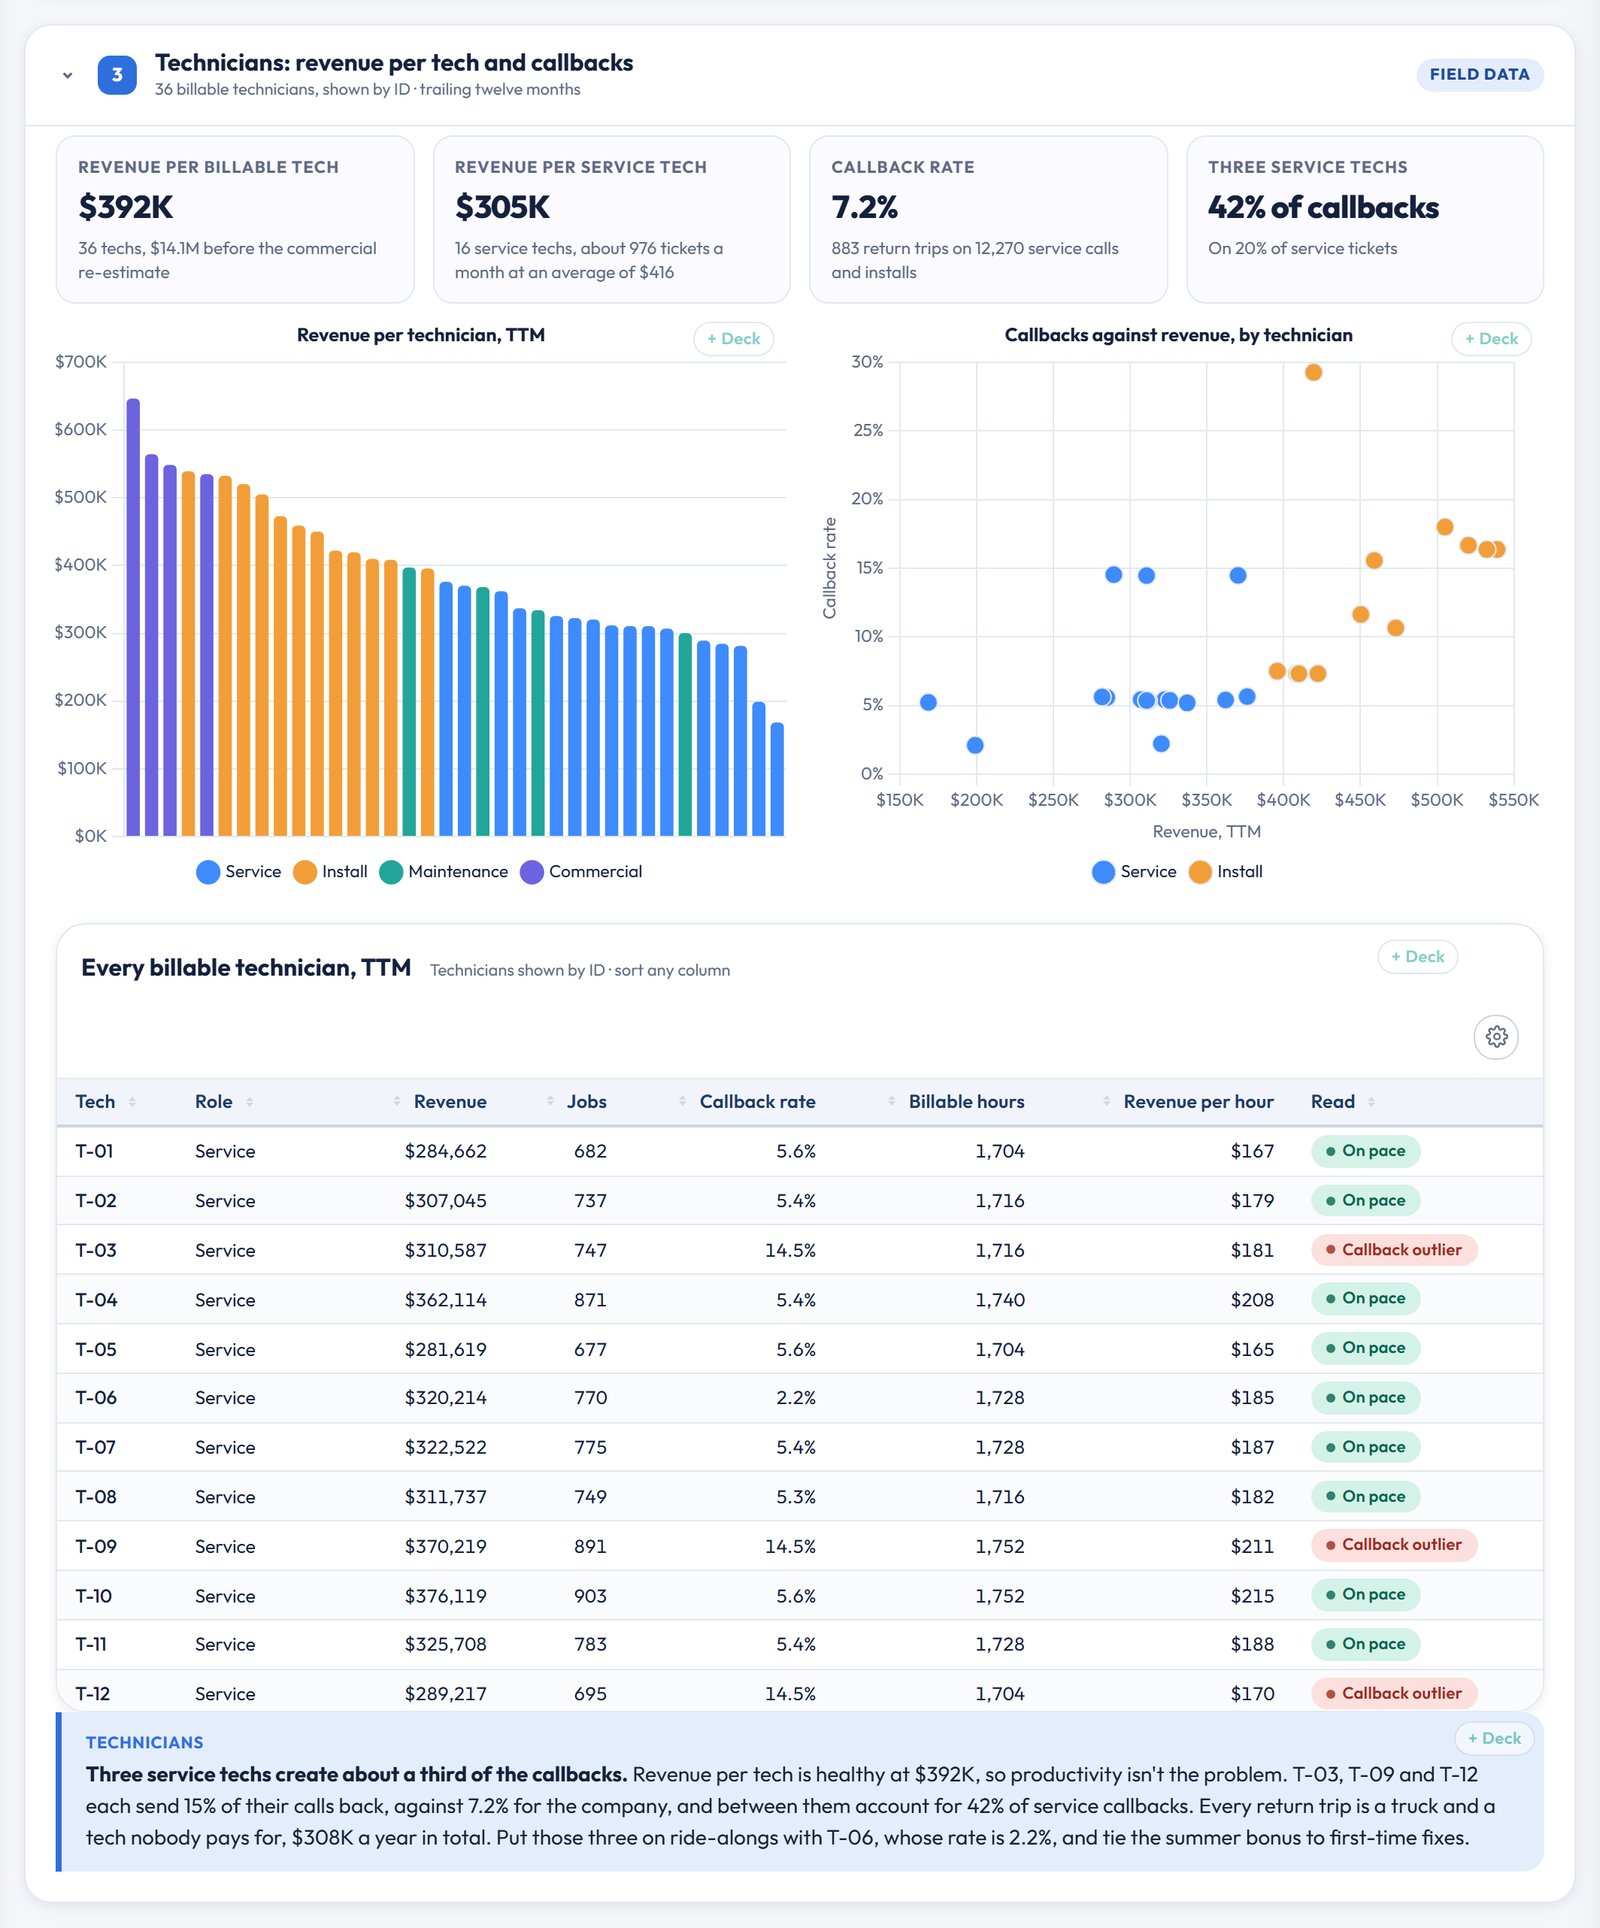
Callbacks have names on them
Revenue per billable technician is $392K, which is healthy. The leak is callbacks: 7.2% of calls and installs come back as a trip nobody pays for, $308K over the year. Three service techs, T-03, T-09 and T-12, each send about 15% of their calls back and between them account for 42% of service callbacks. T-06 runs 2.2%. Put the three on ride-alongs with T-06 and tie the summer bonus to first-time fixes before anyone buys another truck.
People and payroll: the question after the price
This section is new on the page, and it's the one I'd expect a platform to ask about right after the multiple: who stays after the deal closes? The payroll file answers it once it's tied to the field data.
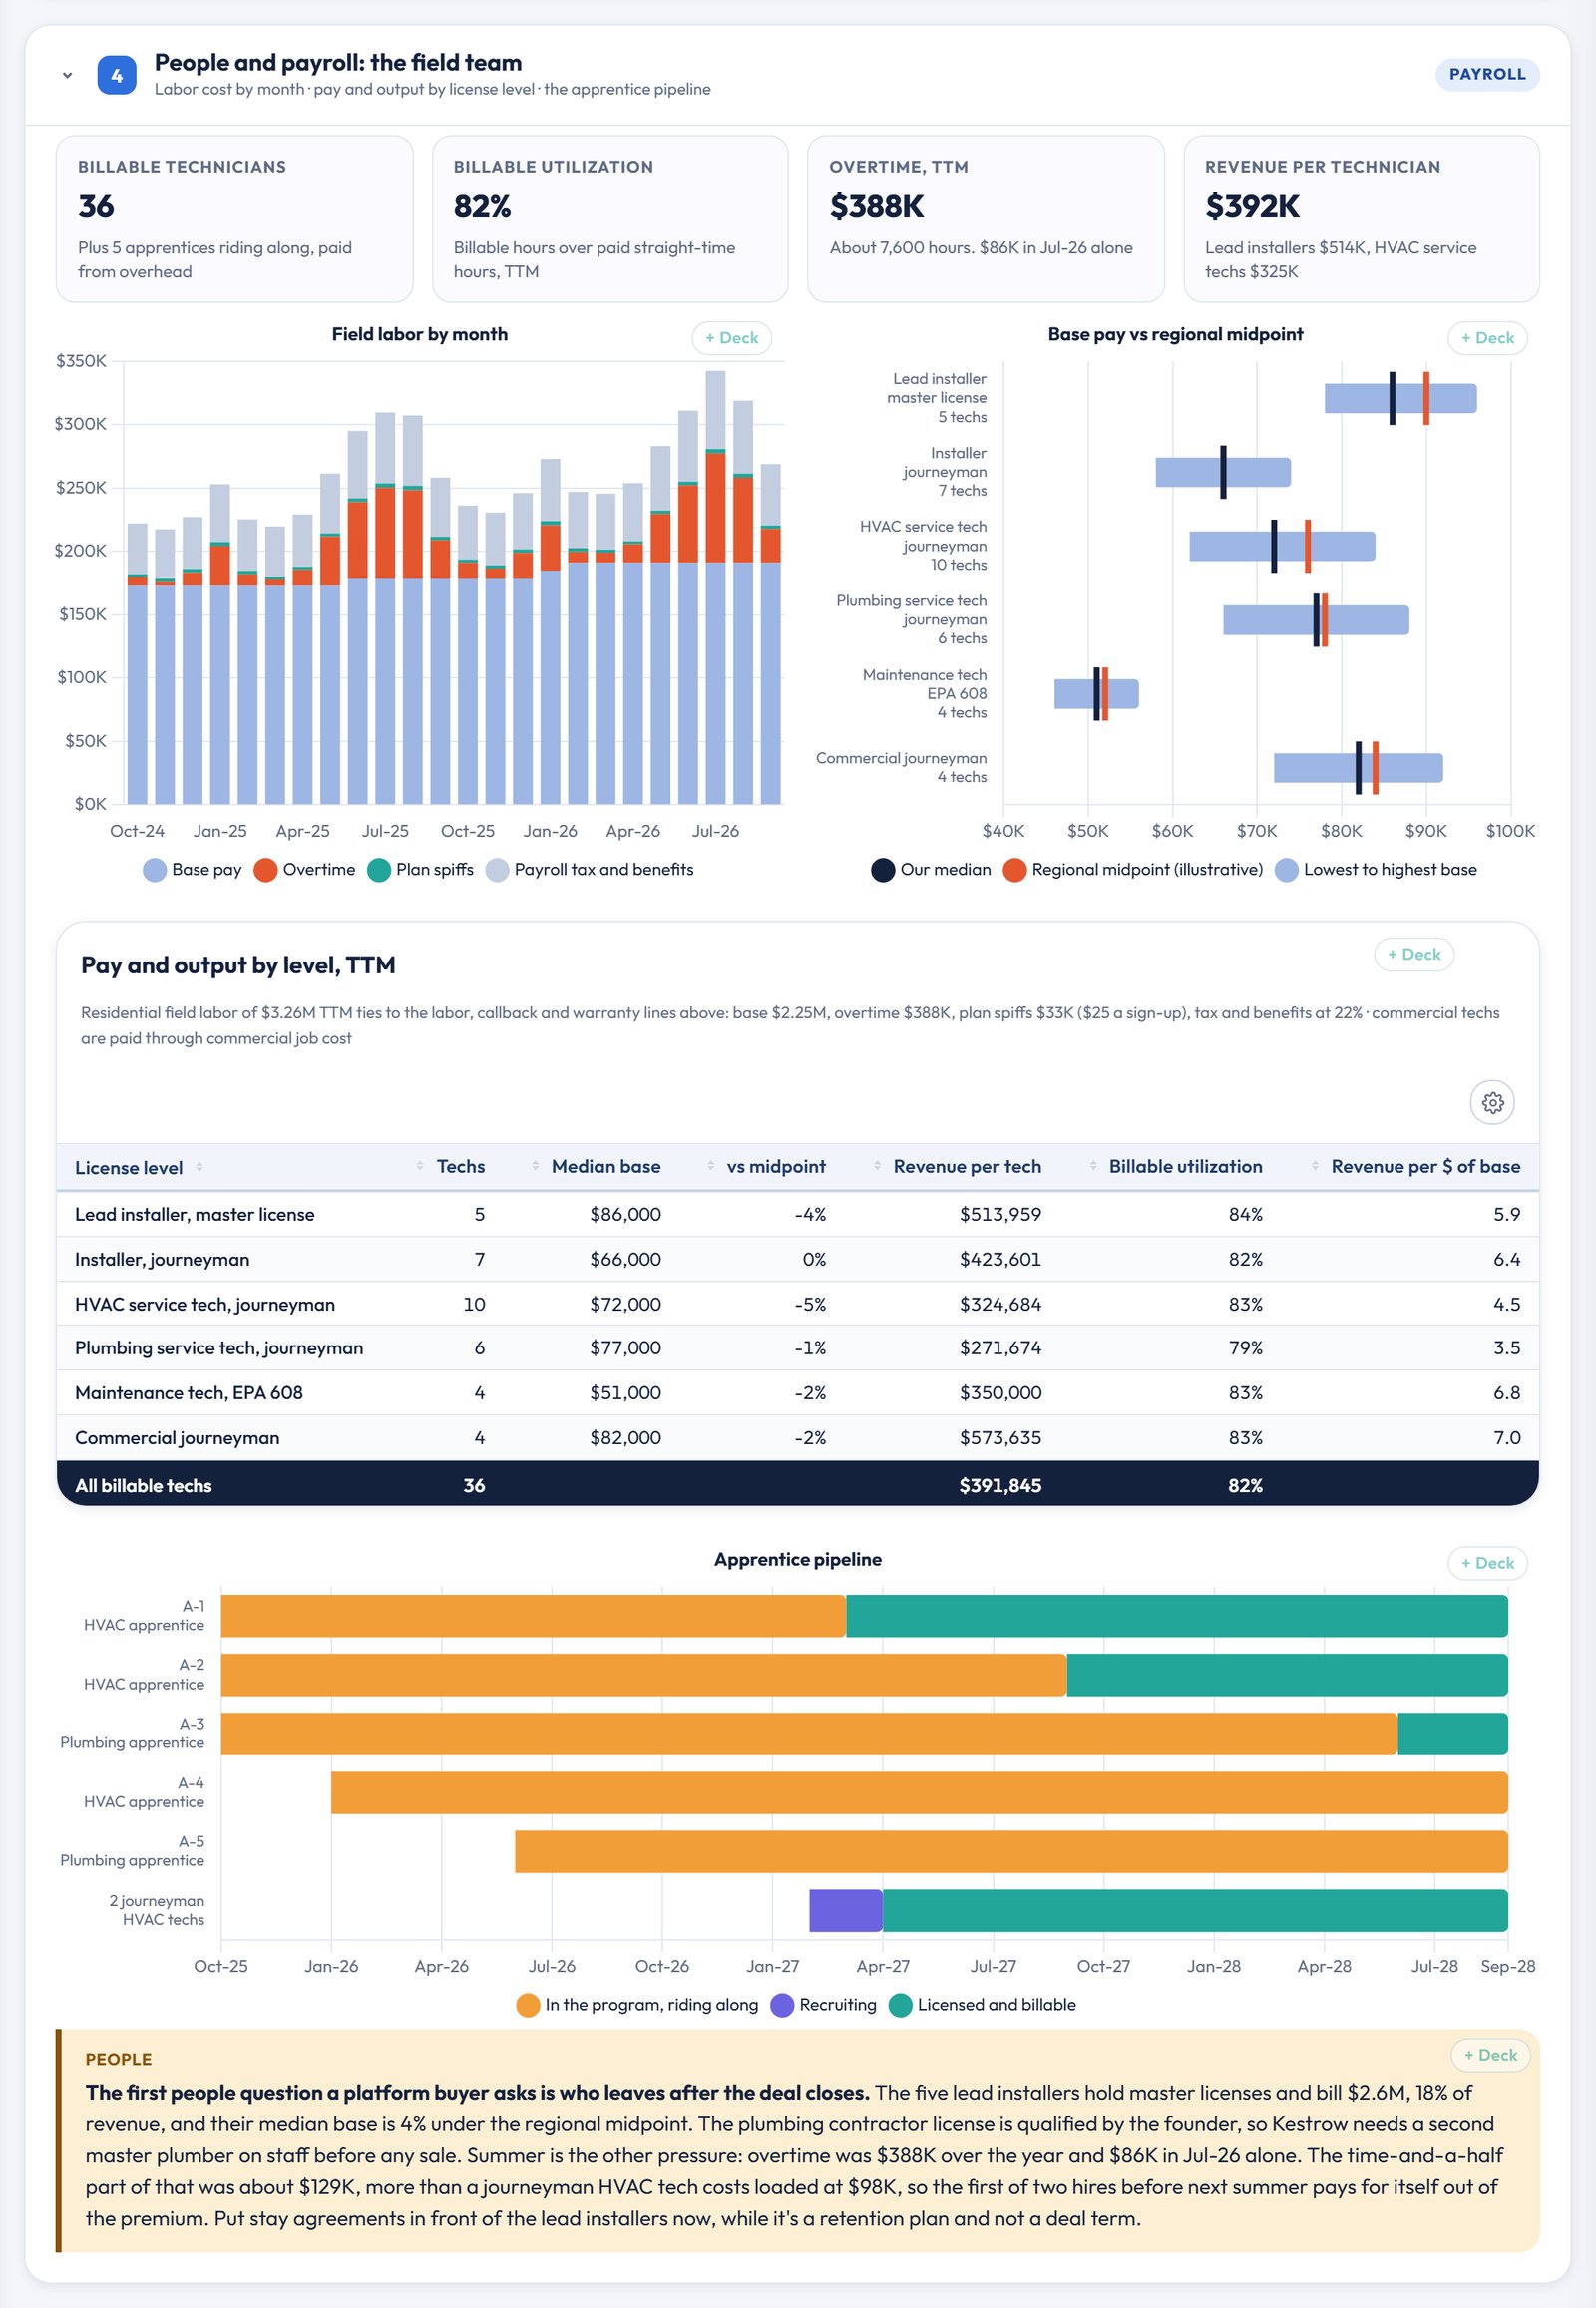
The five lead installers hold master licenses and bill $2.6M, about 18% of revenue, and their median base is 4% under the regional midpoint. They're the people a competing platform calls first. The plumbing contractor license is qualified by the founder, so Kestrow needs a second master plumber on staff before any sale. Stay agreements for the lead installers cost far less as a retention plan this year than as a deal term next year.
Summer is the other pressure. Residential field labor was $3.26M over the year, and it splits into base pay, plan spiffs, payroll tax and benefits, and overtime. Overtime was $388K, and $86K of it landed in July. The time-and-a-half part alone was about $129K, more than a journeyman HVAC tech costs loaded, so the first of two hires before next summer pays for itself. The apprentice pipeline shows the slower fix: five apprentices riding along now, the first two licensed in 2027.
The membership plan is the business
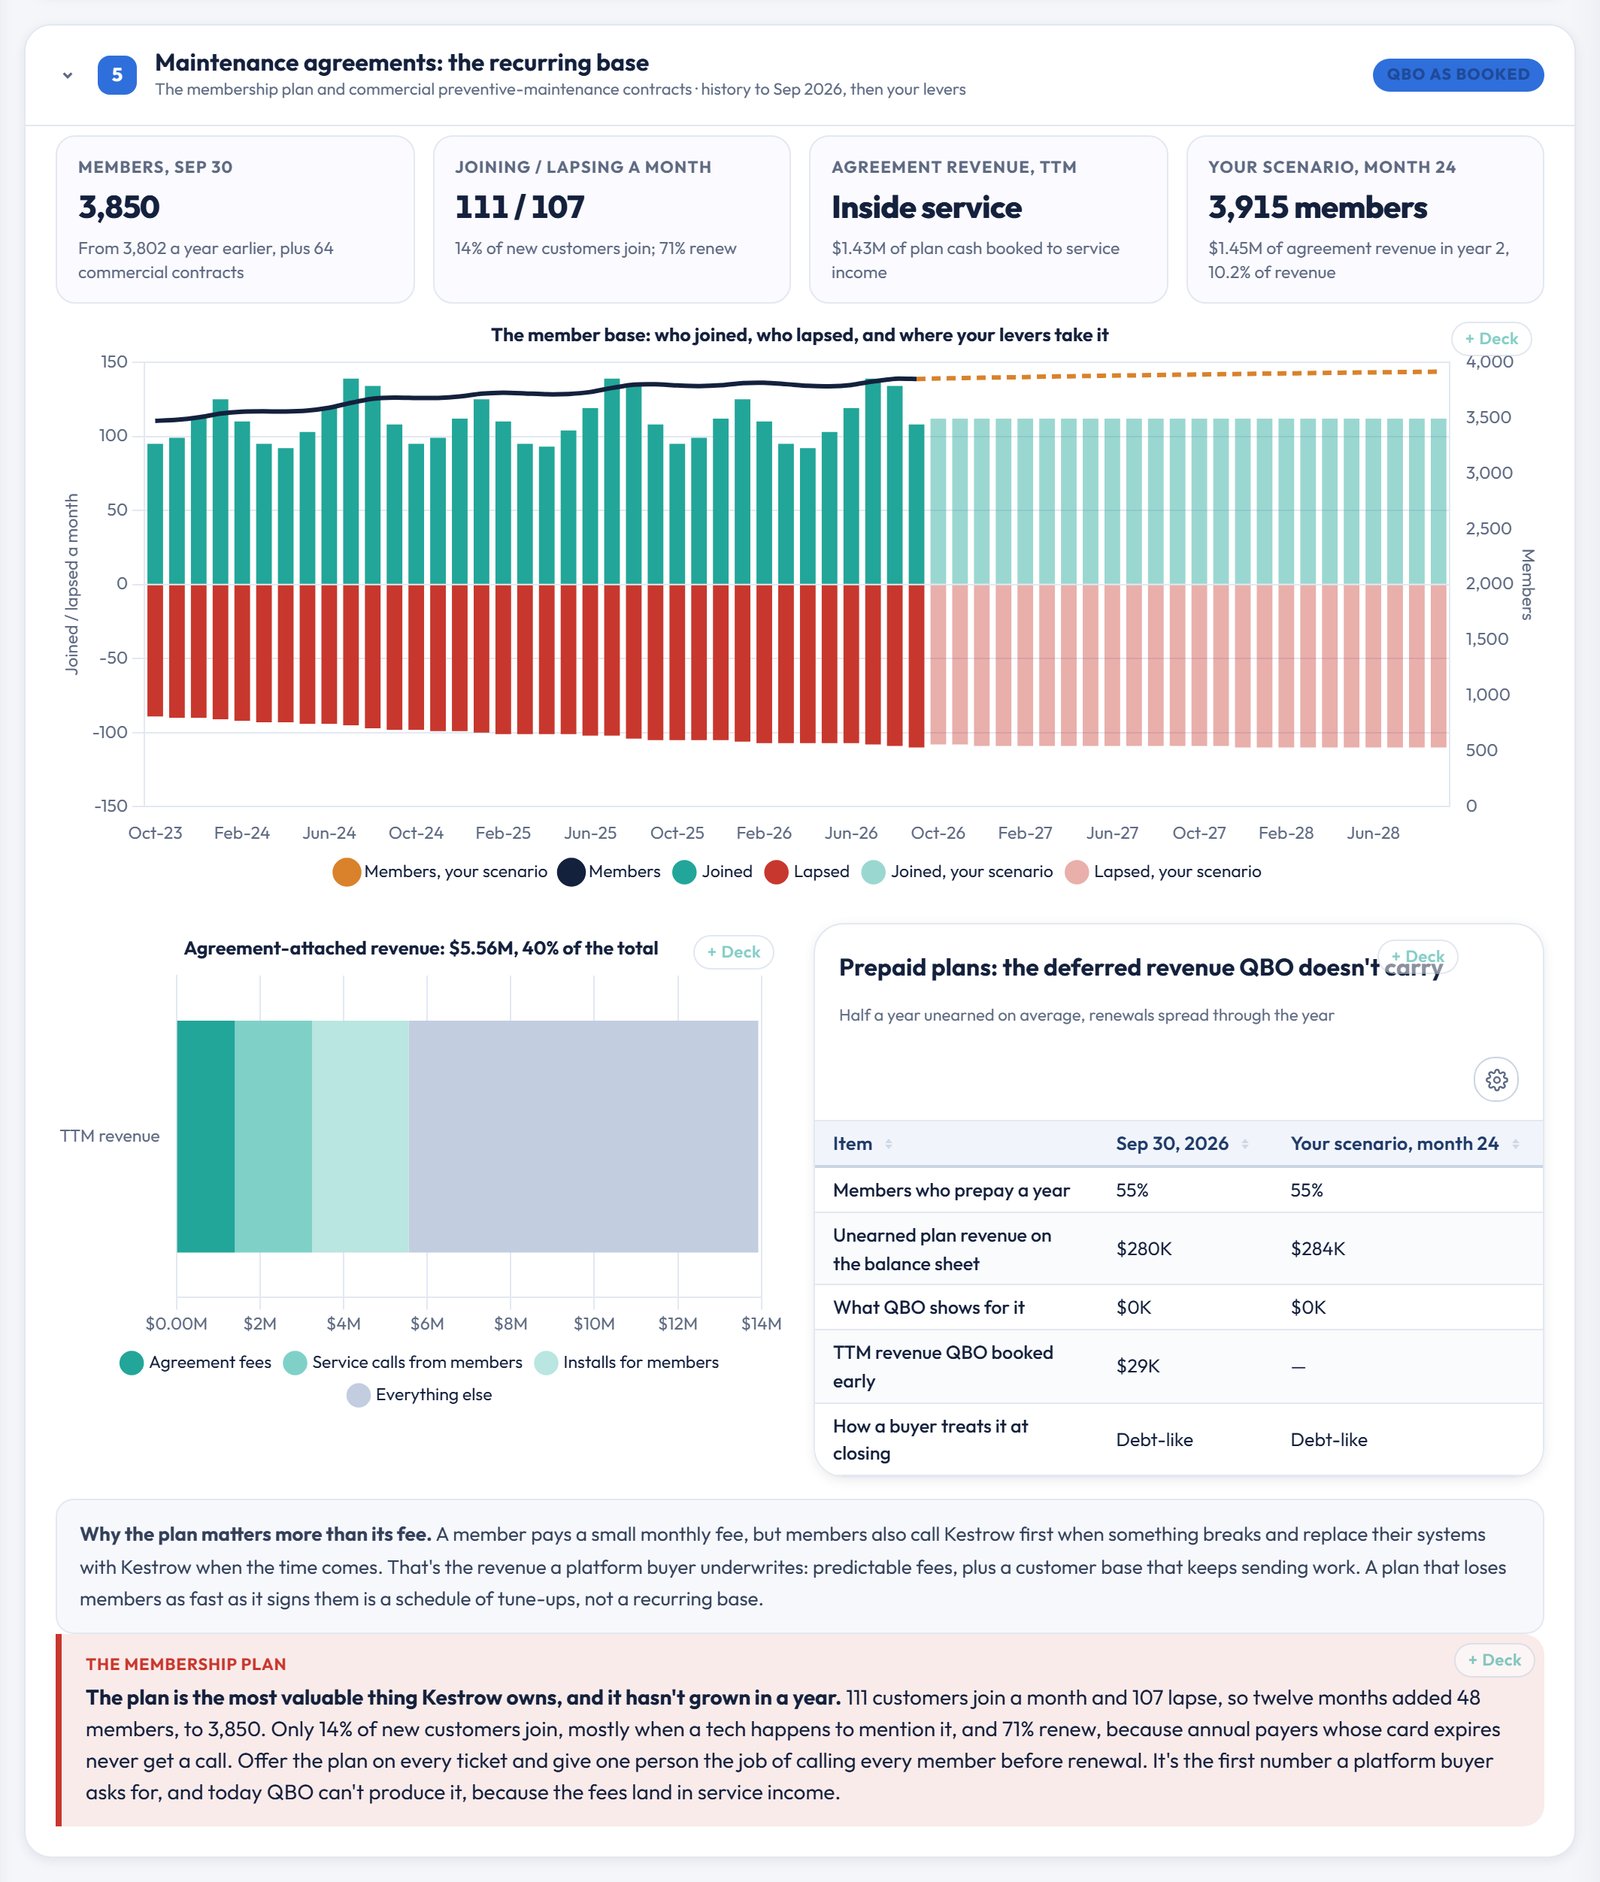
Kestrow has 3,850 members, up 48 in a year. About 111 customers join a month and 107 lapse. Only 14% of new customers join, mostly when a tech happens to mention it, and 71% renew, because annual payers whose card expires never get a call. Members also call Kestrow first when something breaks and replace their systems with Kestrow when the time comes, so the plan carries far more revenue than its fee.
The fix is two habits. Offer the plan on every ticket, and give one person the job of calling every member before renewal. It's the first number a platform asks for, and today QBO can't produce it, because the fees land in service income.
Tie the field software to QBO
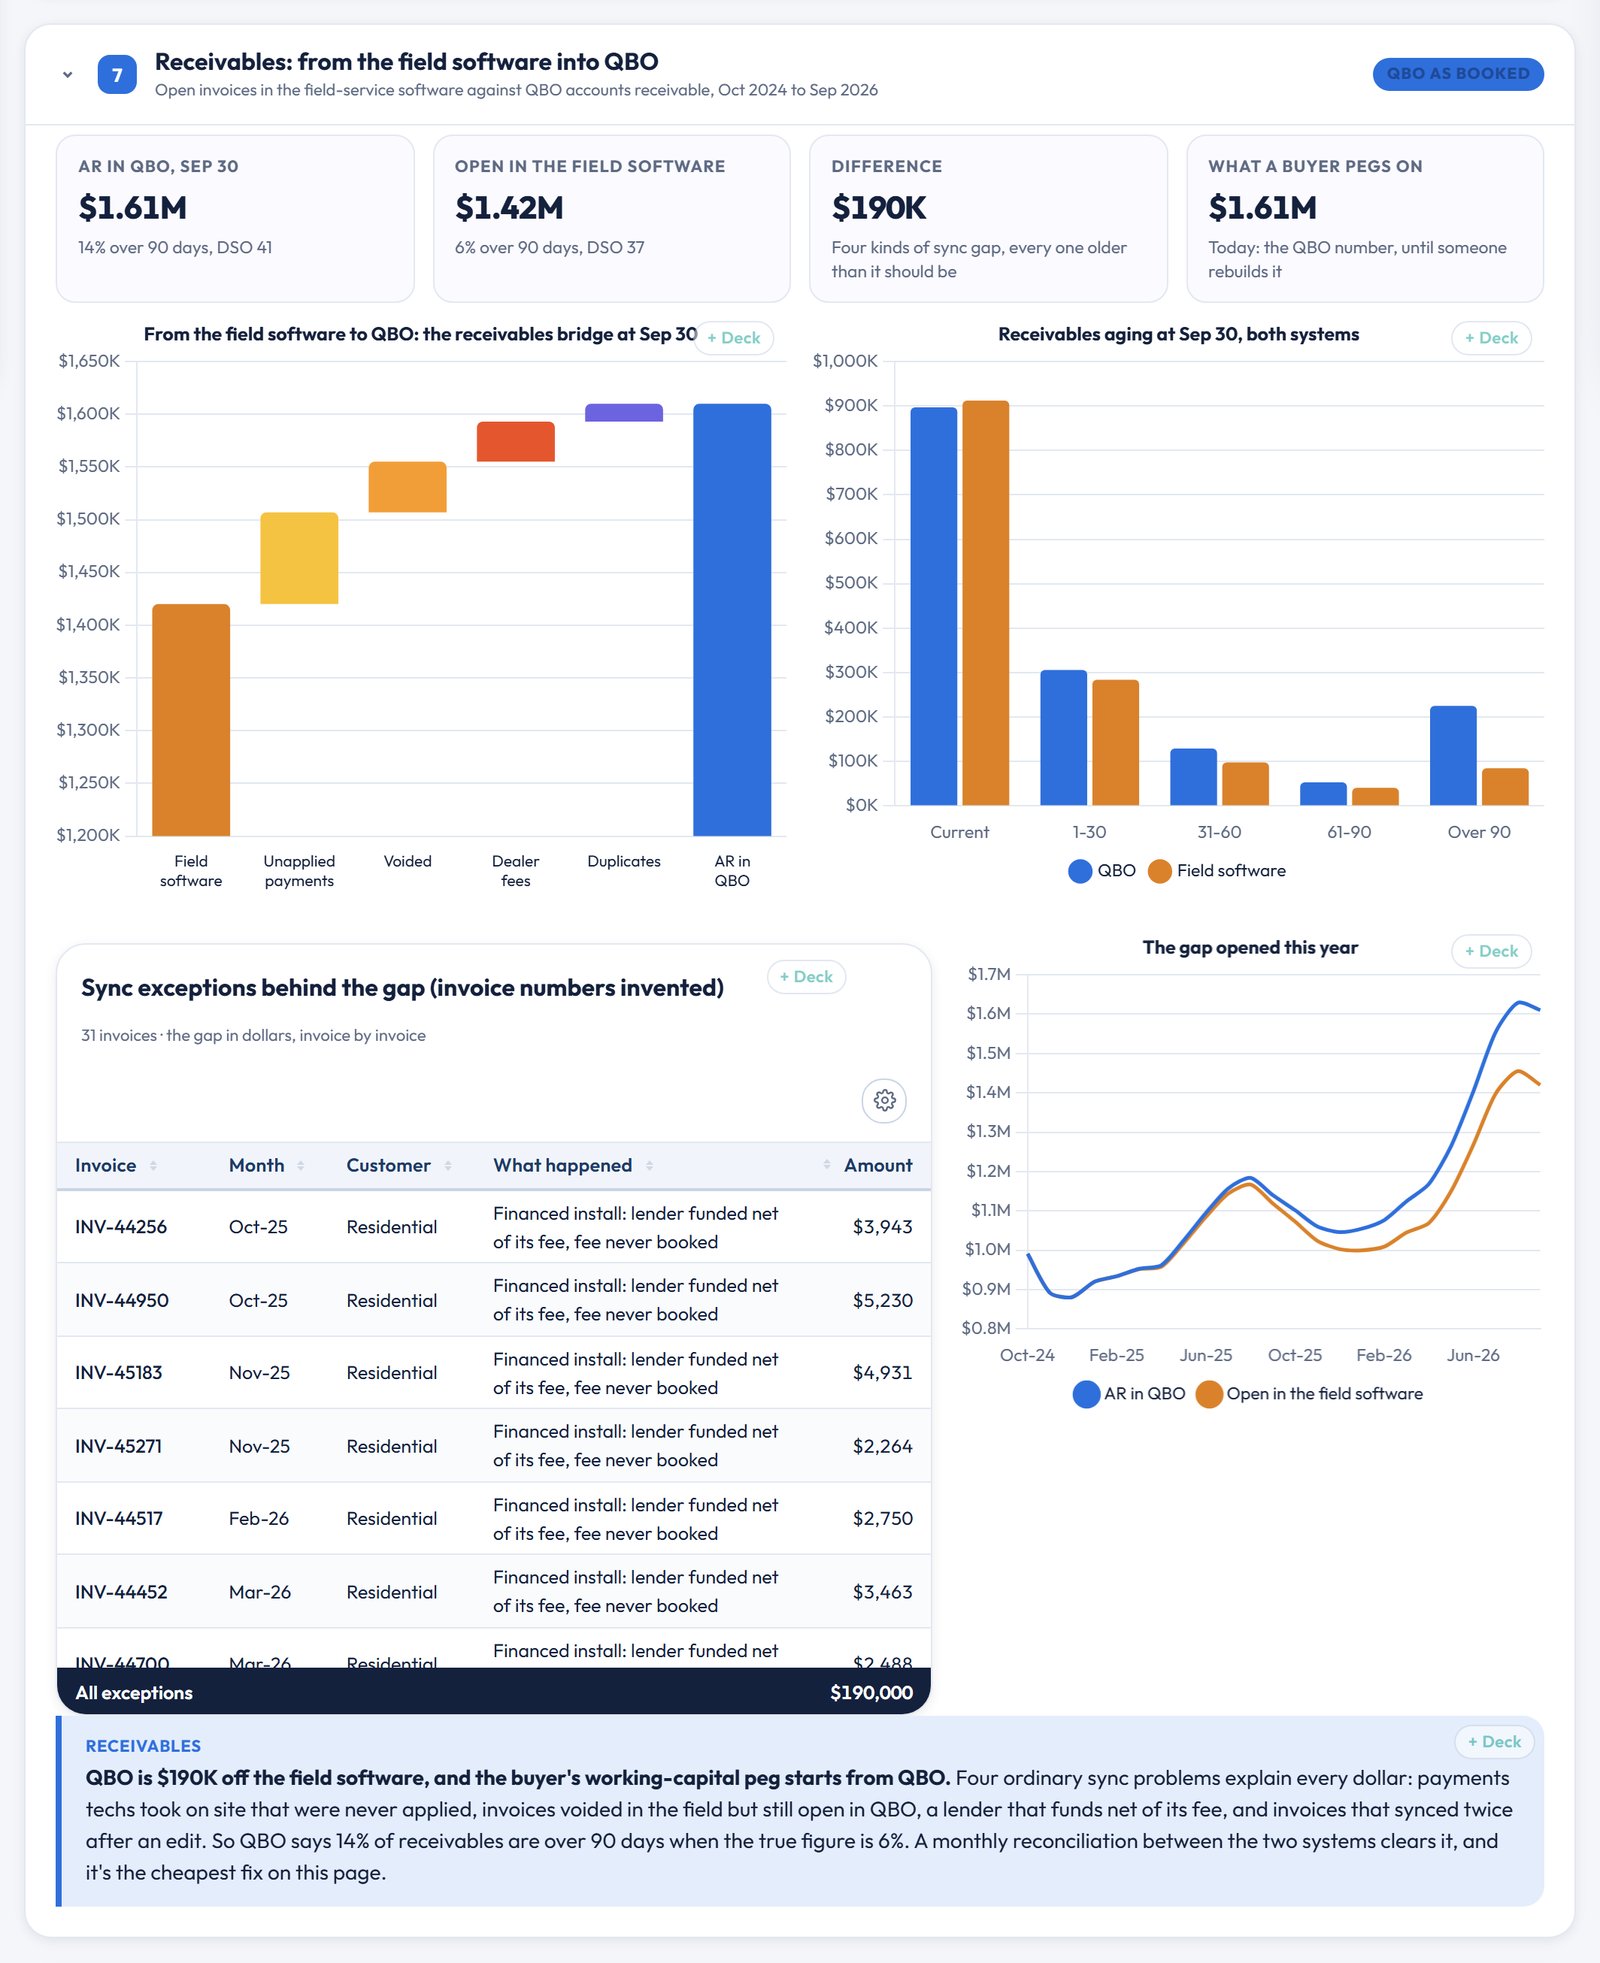
QBO is $190K off the field software, and the buyer's working-capital peg starts from QBO. Payments techs took on site that were never applied, invoices voided in the field but still open, lender fees and duplicate syncs explain every dollar. QBO says 14% of receivables are over 90 days when the true figure is 6%. A monthly reconciliation clears it, and it's the cheapest fix on the page.
The 24-month plan and the board deck
The levers on the left move the next 24 months while the closed months stay locked. The 24-month plan button sets the ones I'd actually work on: 22% attach, a $25 plan, 84% renewal, callbacks at 3.5%, monthly reconciliation and a membership coordinator. On those settings the base grows to about 6,300 members and adjusted EBITDA reaches $2.42M. Enterprise value goes from $7.14M to $14.55M.
Half of that gain needs a caveat, so the page shows it separately. $3.77M comes from more EBITDA at today's 4.5x, which is earned. The other $3.64M comes from an illustrative multiple of 6.0x, and every buyer weighs those steps differently. Every card, chart and table has a + Deck button, and the buyer-ready pack builds an editable PowerPoint for that first meeting. If a sale is on the horizon, the exit readiness demo, our transaction readiness guide and nine things to know before due diligence cover the rest.
Why not just do this yourself with AI?
Use AI. We do, every day. But the analysis was never the hard part. Every finding above came from four things a chatbot doesn't have:
- Transaction-level data, kept current. Tickets, installs, callbacks, members, job costs and payroll by technician, pulled automatically from the field-service software, QBO and payroll after every close, and reconciled so the two systems agree.
- Context nobody wrote down. That the founder qualifies the plumbing license, that the lender funds net of its fee, that annual payers never get a renewal call. We add it to the data so it shows up next to the numbers it explains.
- Somewhere safe to keep it. Read-only connections, a secured warehouse and access controls, instead of customer lists and technician pay pasted into a chat window.
- Someone accountable for it. A CFO who'll tell you which three techs need a ride-along and which retrofit is underwater, and then sit beside you on the call with the buyer.
What it takes to get this on your own numbers
We connect read-only to QBO, your field-service software and payroll, rebuild margin by job type from the tickets, installs and job costs, tie your receivables between the two systems every month, and measure the membership base the way a buyer will. Then it refreshes after every month-end close.
That's CFOptimize – accelerate your growth, built for service owners who want the recurring revenue they've already earned to show up in the numbers, whether or not a sale is on the table. If you'd like to see it on your own books, grab time with me and we'll walk through it together. You can also browse the other demos in our showcase.
Mark
Kestrow Air & Plumbing and every customer, project and person named in this post are fictional, and every figure is invented for illustration. Nothing here is drawn from any client's books. Pay midpoints, multiples and the multiple ladder are illustrative assumptions, not market quotes, and nothing here is tax, legal or investment advice.
Share