Sponsors and GPs of small real estate funds and syndications, roughly $50 to 300M of assets, and the real estate CPAs, attorneys and lenders who read their numbers.
Which loans can refinance at today's terms, whether the distribution is covered, and what the LPs and the promote are actually worth if everything sold today.
The first call on a refinance rarely goes the way a sponsor expects. The lender doesn't ask how the portfolio did. They ask for one building's trailing twelve months, its rent roll, and the extension test in the loan agreement, and then they ask what the fund plans to pay its investors while all three of its loans come due. That last question is the one most sponsors haven't answered yet.
A summary of the quarterly financials won't answer it either. Any sponsor can paste a P&L into an AI now and get a tidy paragraph back about NOI and occupancy. What that paragraph can't tell you is which loan has a coverage test the building fails, which tenant just went dark, or how many dollars of NOI stand between a property and its bank covenant. That lives in the loan agreements, the servicer reports, the rent rolls and seven sets of books, and somebody has to connect them and know the loans well enough to read them.
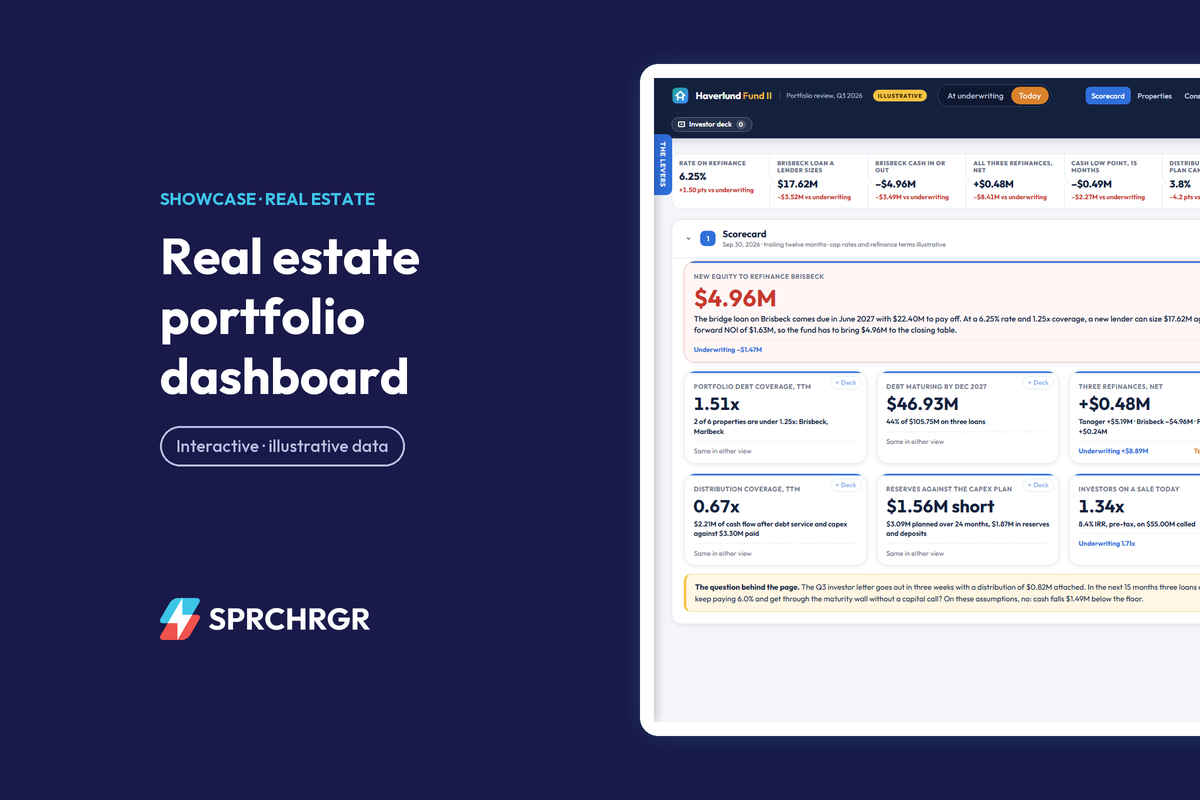
So here's how I'd walk a sponsor through a quarter using a working sample dashboard we built for a fictional sponsor called Haverlund Real Estate Partners: a 2022-vintage fund with $55.0M of investor equity, six properties in six metros, one LLC each, and $105.7M of debt. The company, its properties, tenants and lenders are invented. The patterns aren't. Open it in another tab and follow along.
The quarter in three sentences
This is the paragraph at the top of the page, written the way I'd want a sponsor to say it to an LP or a lender:
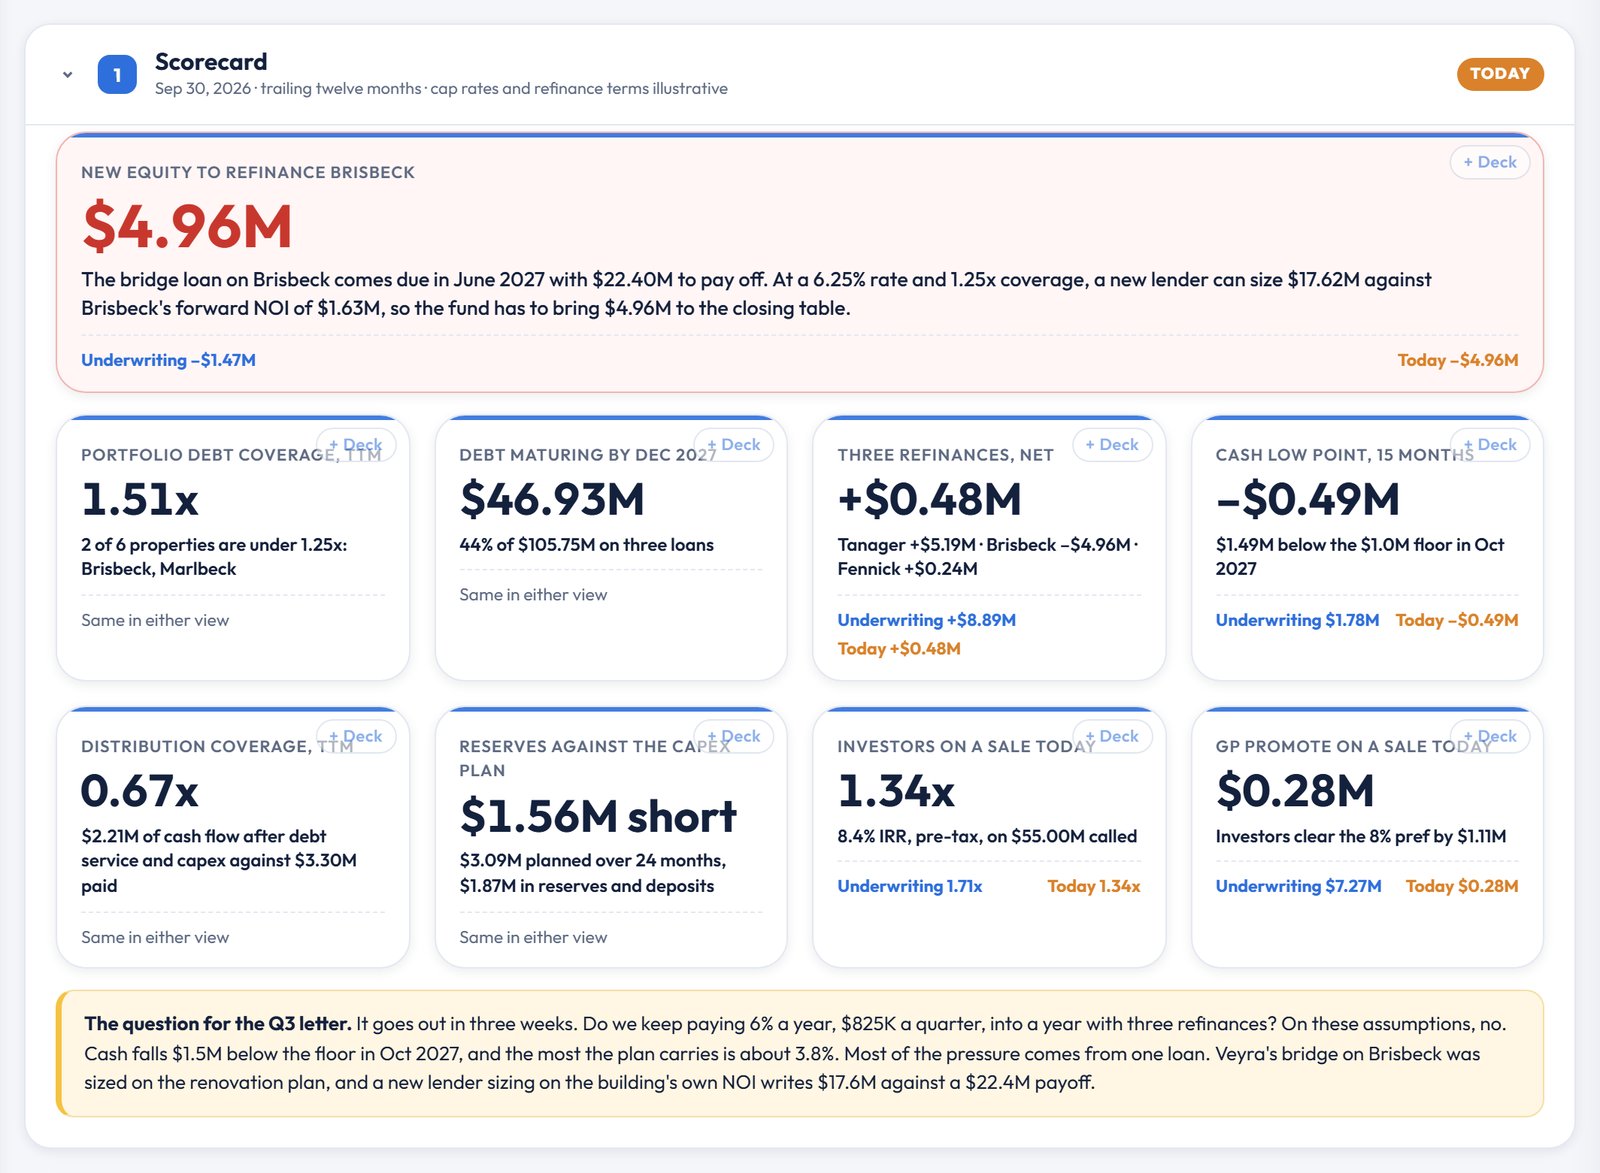
We made $2.45M of NOI in the third quarter. Five of the six properties grew about 4% on a year ago, and Marlbeck fell 27% after Hollin & Rye closed its store in March. The harder news is 2027: $46.9M of debt comes due on three loans, Brisbeck needs about $5.0M of new equity to refinance, and at our 6% distribution cash runs $1.5M below our $1.0M floor by October 2027, so we're recommending 3% in the Q3 letter.
A summary of the P&L gets the first sentence. The rest needs the loan files.
Coverage, loan by loan
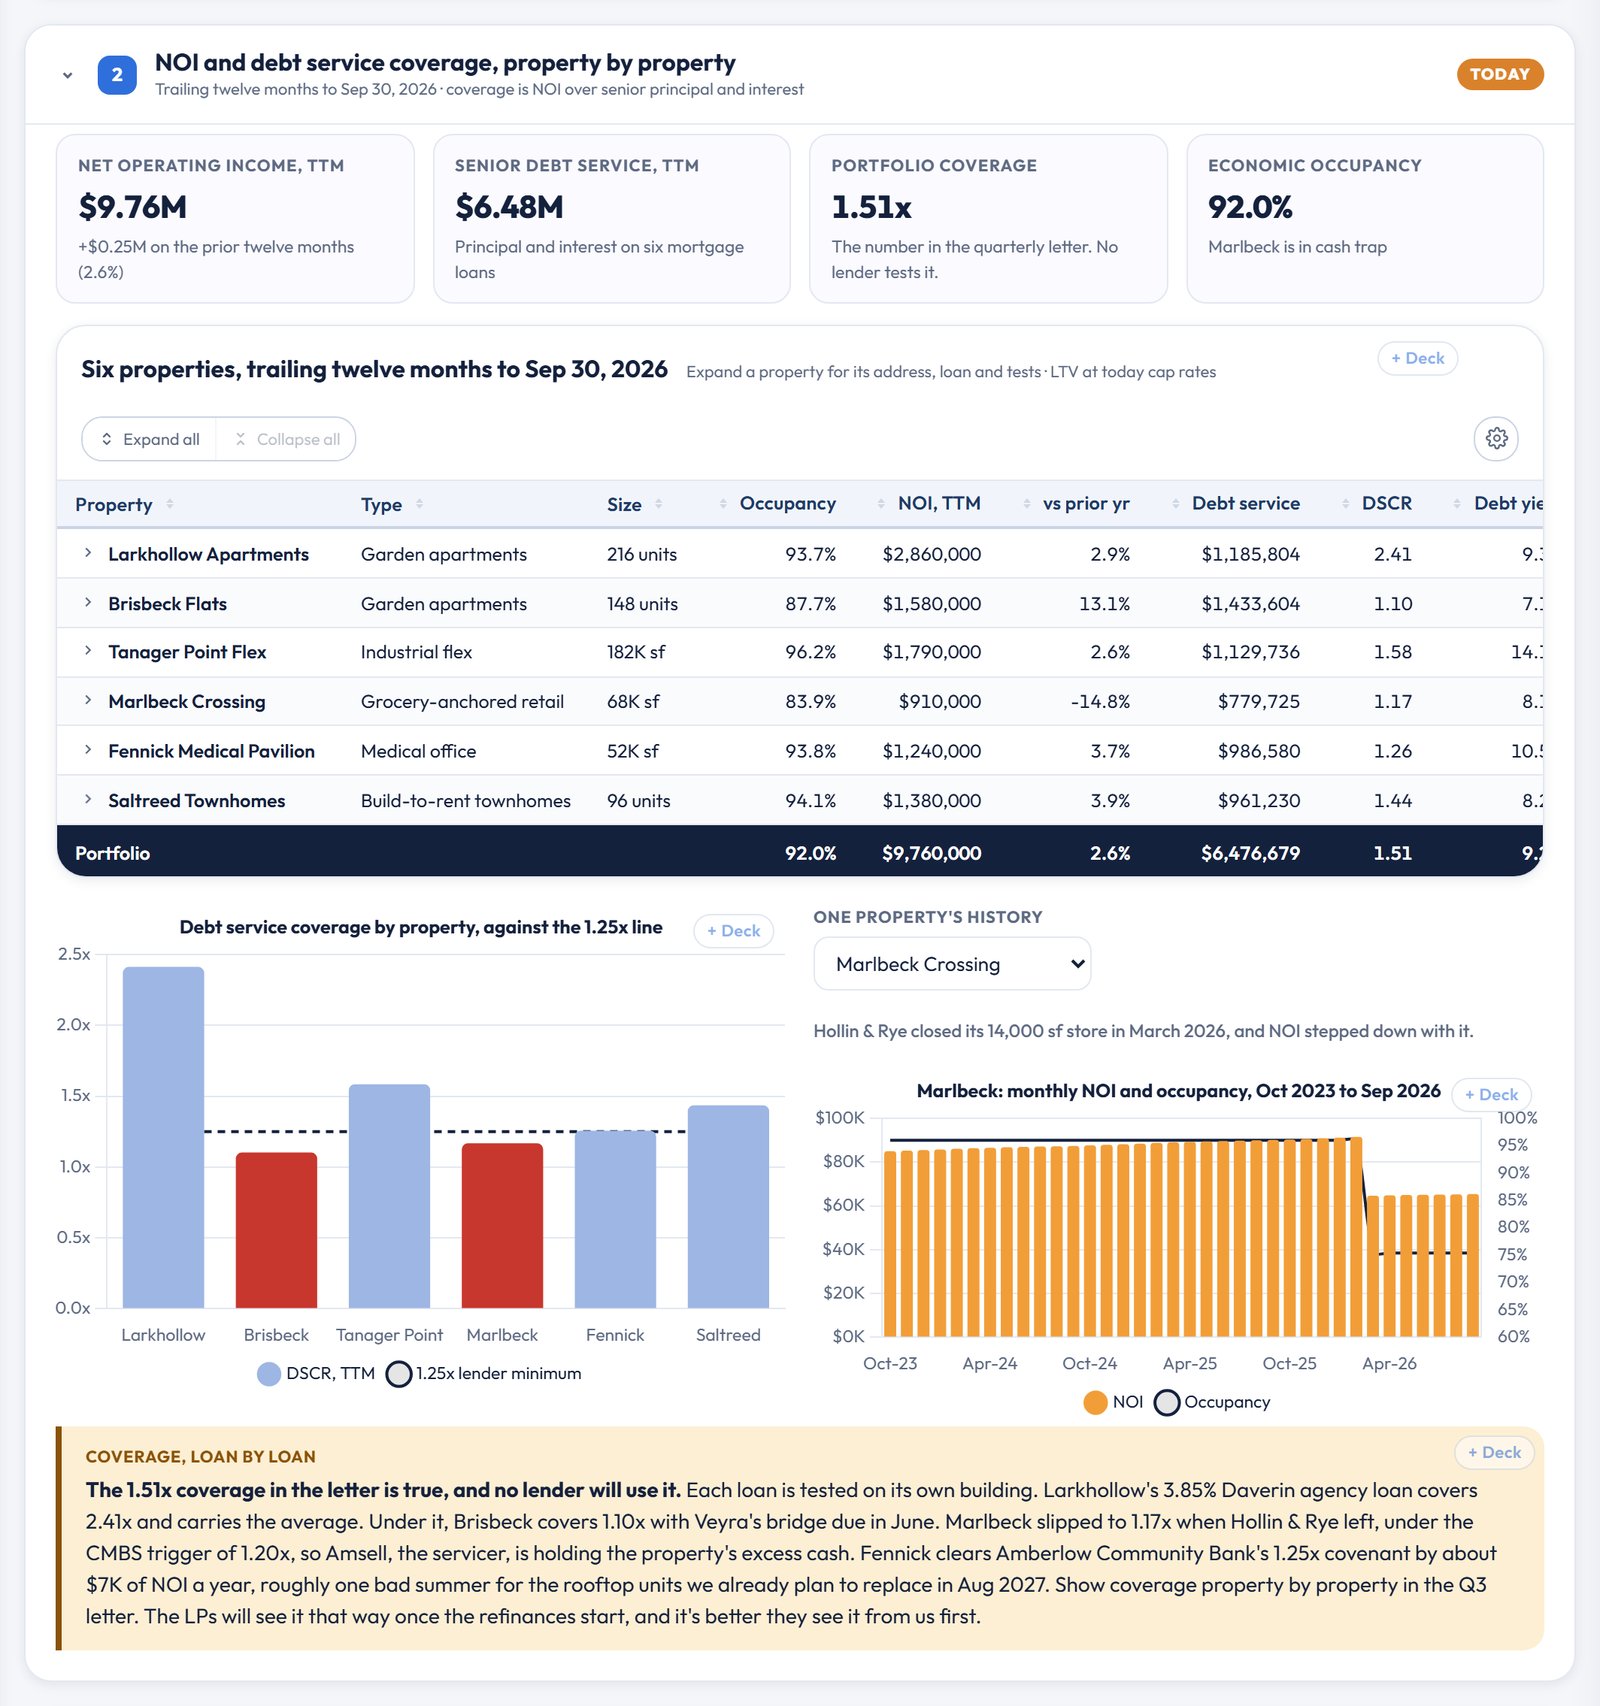
The quarterly letter says the portfolio covers its debt service 1.51 times. That's true, and no lender will ever use it, because each loan is tested on its own building. Larkhollow's 3.85% agency loan from Daverin Mortgage Capital covers 2.41 times and carries the average. Underneath it:
- Brisbeck Flats covers 1.10x, and its floating bridge loan from Veyra Bridge Lending comes due in June.
- Marlbeck Crossing dropped to 1.17x when Hollin & Rye Home closed its 14,000 square-foot store in March. That's under the CMBS loan's 1.20x trigger, so Amsell, the servicer, is now holding the property's excess cash.
- Fennick Medical Pavilion clears Amberlow Community Bank's 1.25x covenant by about $7K of NOI a year. That's one bad summer for rooftop units already scheduled for replacement next August.
That last number is the kind nobody puts in a quarterly letter, and it's the one that ends up mattering. I'd show coverage property by property in the Q3 letter. The LPs will see it that way once the refinances start, and it's better they see it from the sponsor first.
The maturity wall, in the order it closes
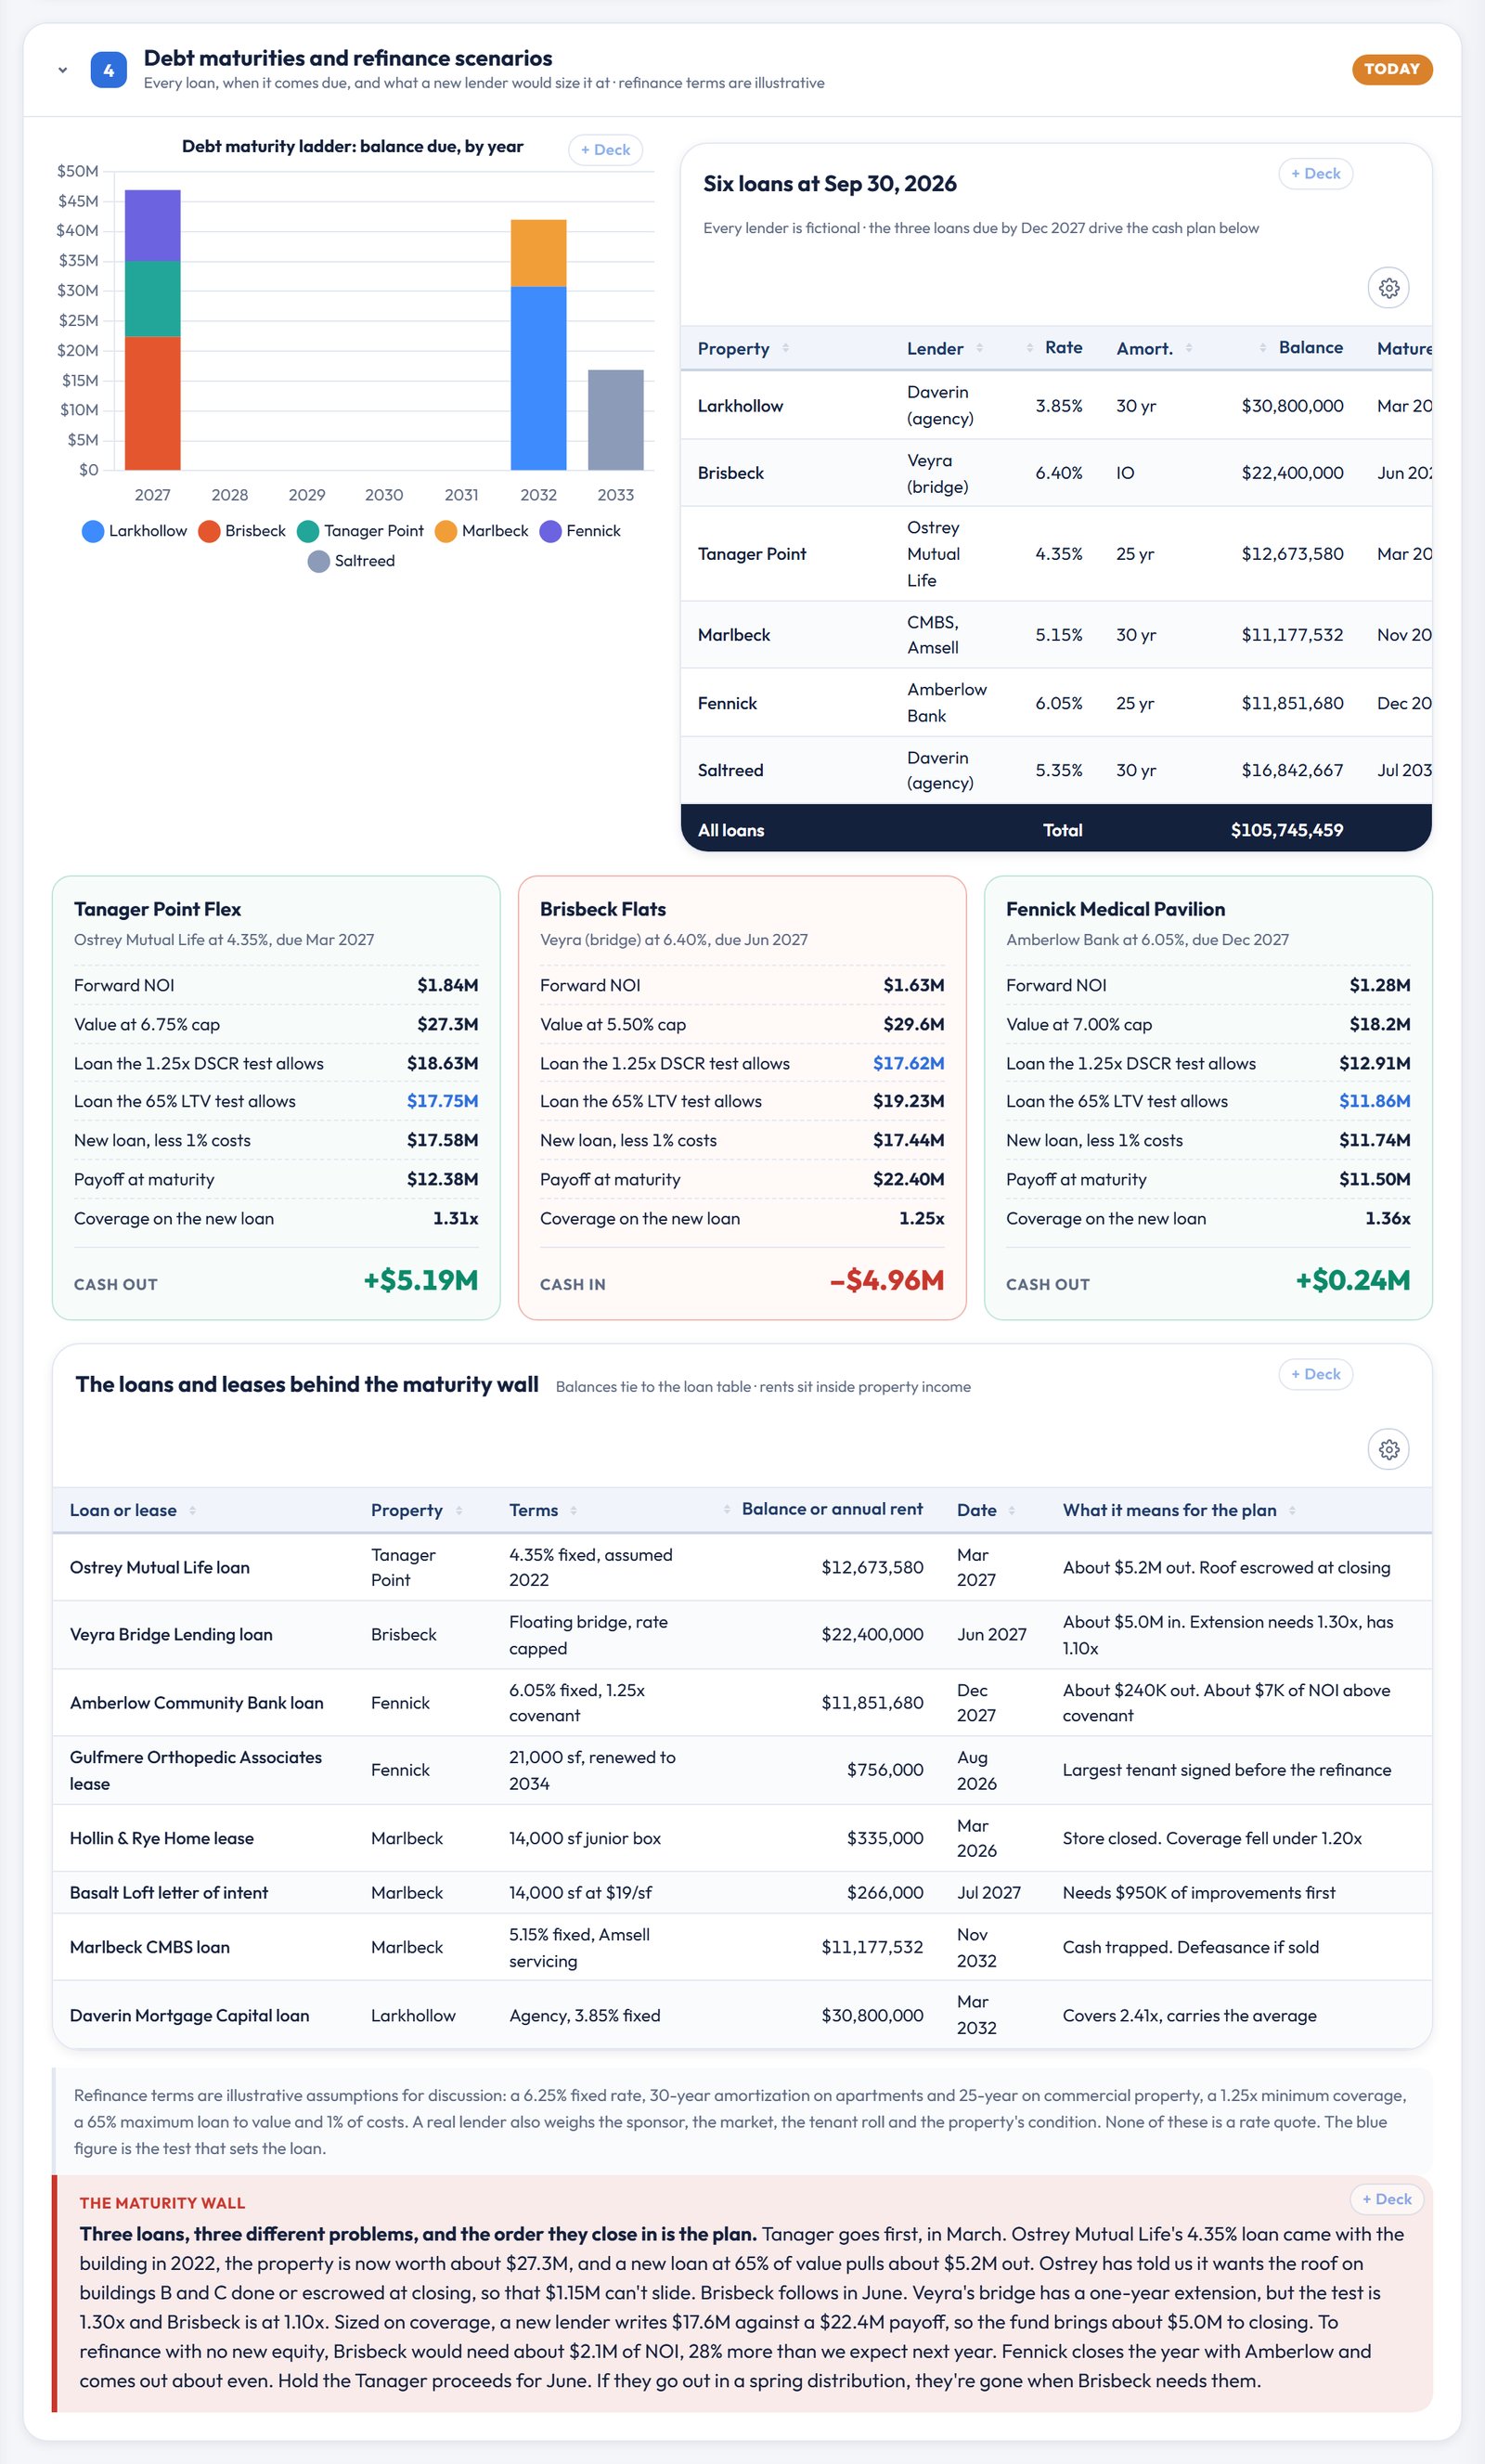
Three loans come due in fifteen months, and each one is a different problem. The order they close in is the plan.
Tanager Point goes first, in March. Its 4.35% loan from Ostrey Mutual Life came with the building in 2022, the property is now worth about $27.3M against a $12.7M balance, and a new loan at 65% of value pulls about $5.2M out. Ostrey has said it wants the roof on buildings B and C done or escrowed at closing, so that $1.15M can't slide into 2028.
Brisbeck follows in June. Veyra's bridge has a one-year extension, but the extension test is 1.30x and Brisbeck is at 1.10x, so it won't qualify. A new lender sizing on coverage writes about $17.6M against a $22.4M payoff, and the fund brings about $5.0M to closing. To refinance with no new equity, Brisbeck would need about $2.1M of NOI, 28% more than we expect next year. The renovation is working, with third-quarter NOI up 11% on last year. It's just running a year behind the loan.
Fennick closes out the year with Amberlow and comes out about even. Gulfmere Orthopedic Associates, its largest tenant, renewed through 2034 in August, which is exactly what a bank wants to see on the rent roll well before maturity.
So the Tanager proceeds have to be held for June. Paid out in a spring distribution, they're gone when Brisbeck needs them.
The distribution decision
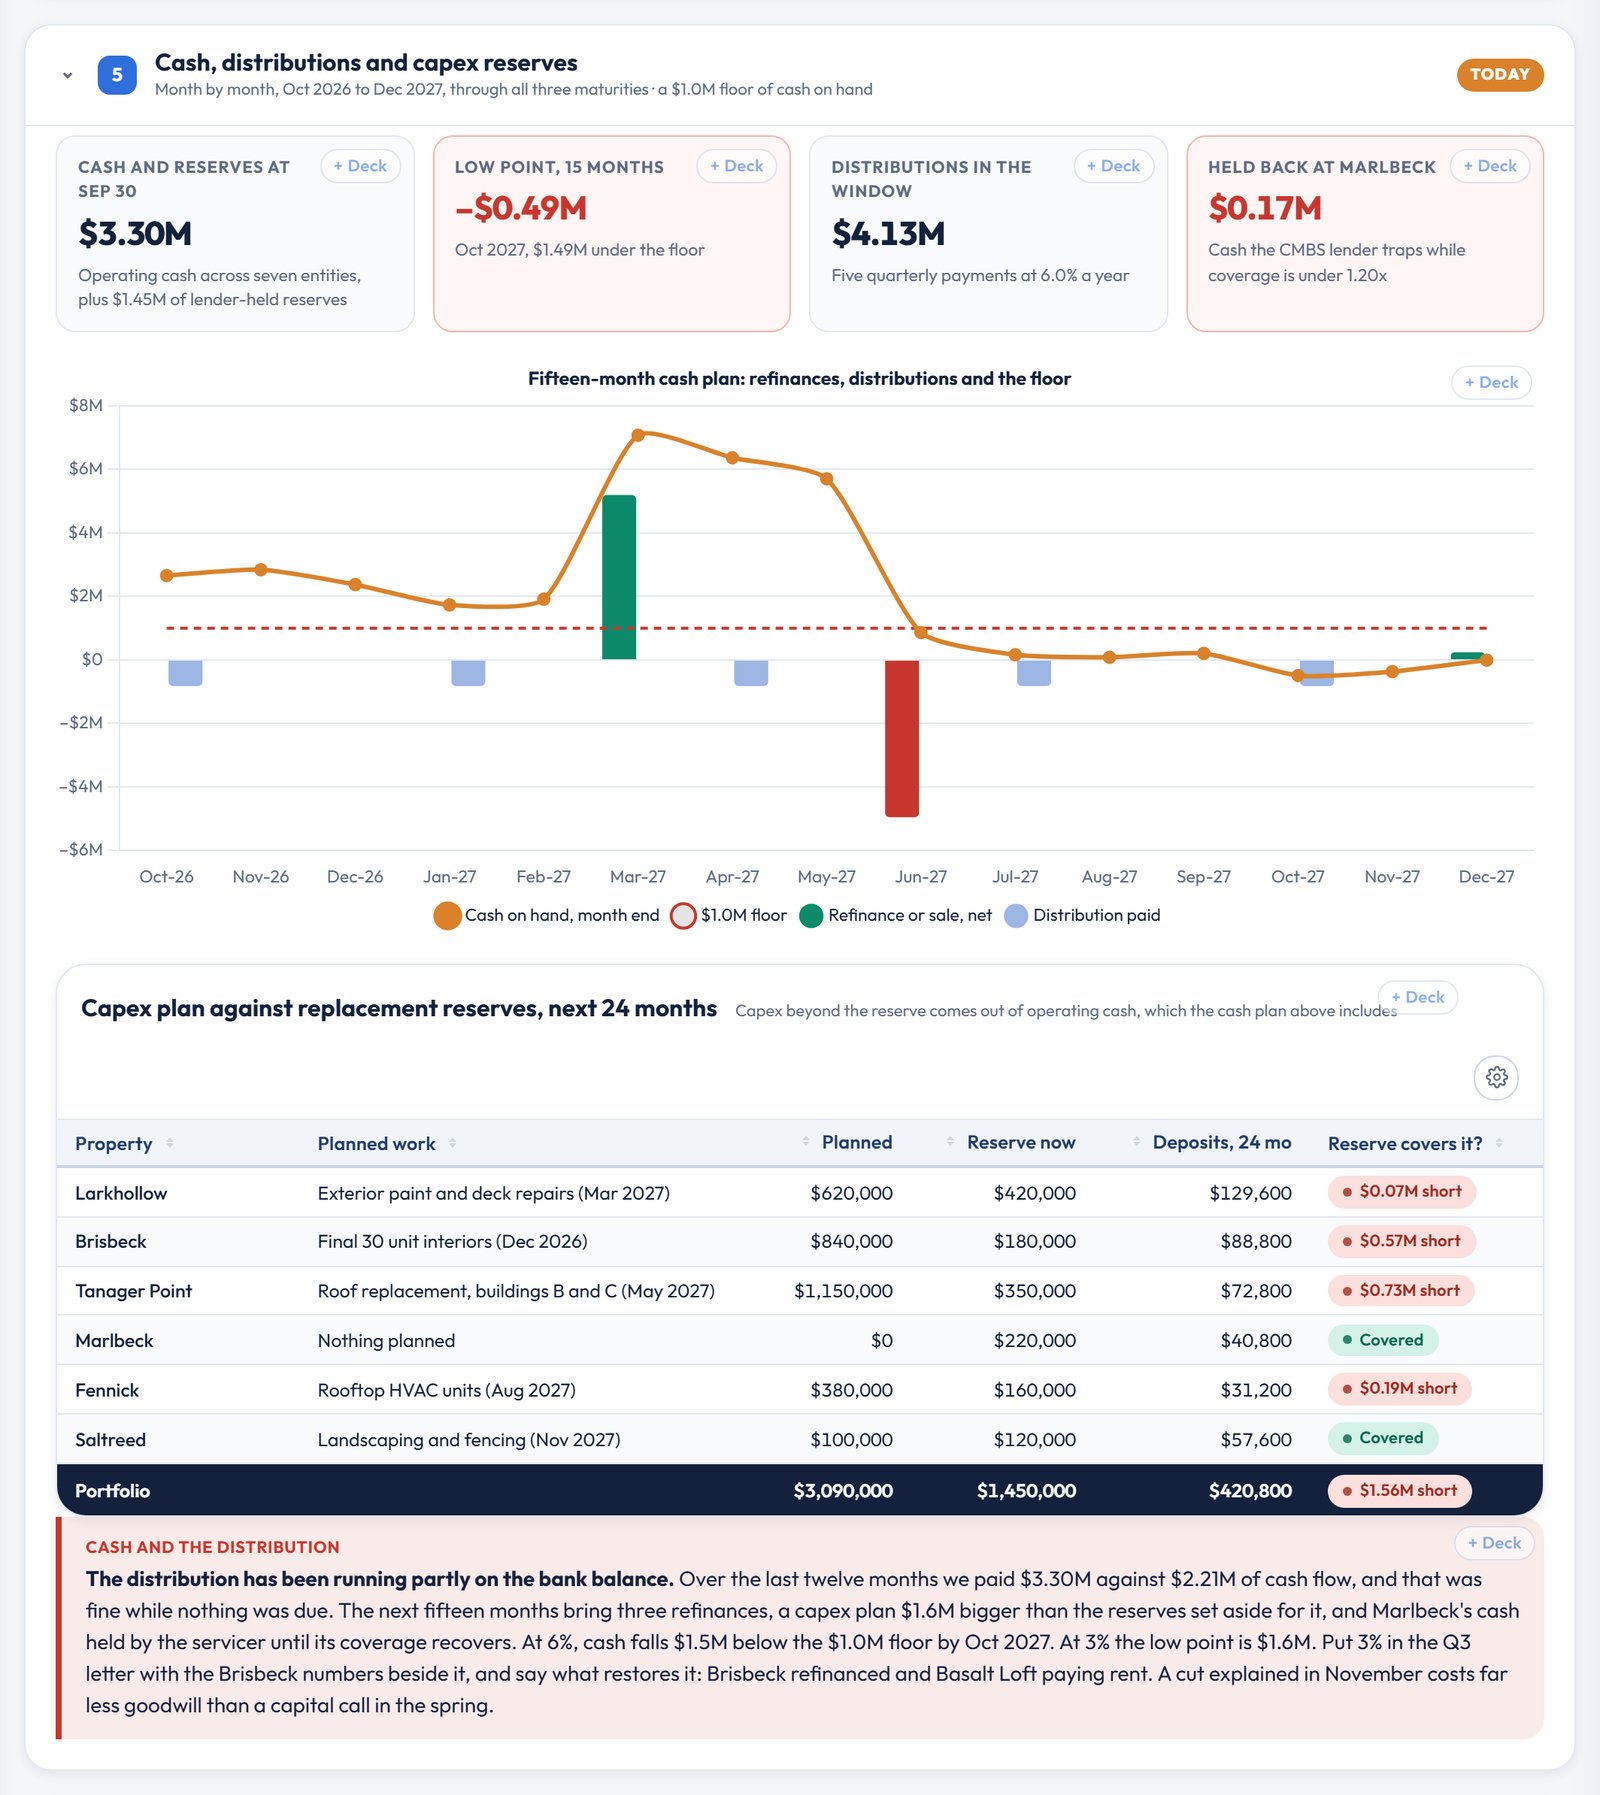
Over the last twelve months the fund paid $3.30M to investors out of $2.21M of cash flow after debt service, capex, reserve deposits and fund costs. About two thirds of the distribution came from operations and the rest came from the bank balance. That was fine while nothing was due.
The next fifteen months bring the three refinances, a capex plan $1.6M bigger than the reserves set aside for it, and Marlbeck's cash held by the servicer. At 6% the fund falls $1.5M below its $1.0M cash floor by October 2027. The most the plan can carry is about 3.8%, and at 3% the low point is $1.6M. The page recommends 3% in the Q3 letter, with the Brisbeck numbers beside it and a plain statement of what restores the rate: Brisbeck refinanced and the Marlbeck box paying rent.
There's one more line in the consolidation worth raising. The fund itself costs $868K a year that no property pays, and $688K of that is the sponsor's asset management fee. If the distribution comes down, offering to defer part of the fee alongside it changes how the letter reads. A cut explained in November costs a sponsor far less goodwill than a capital call in the spring.
Marlbeck can't wait for the refinances
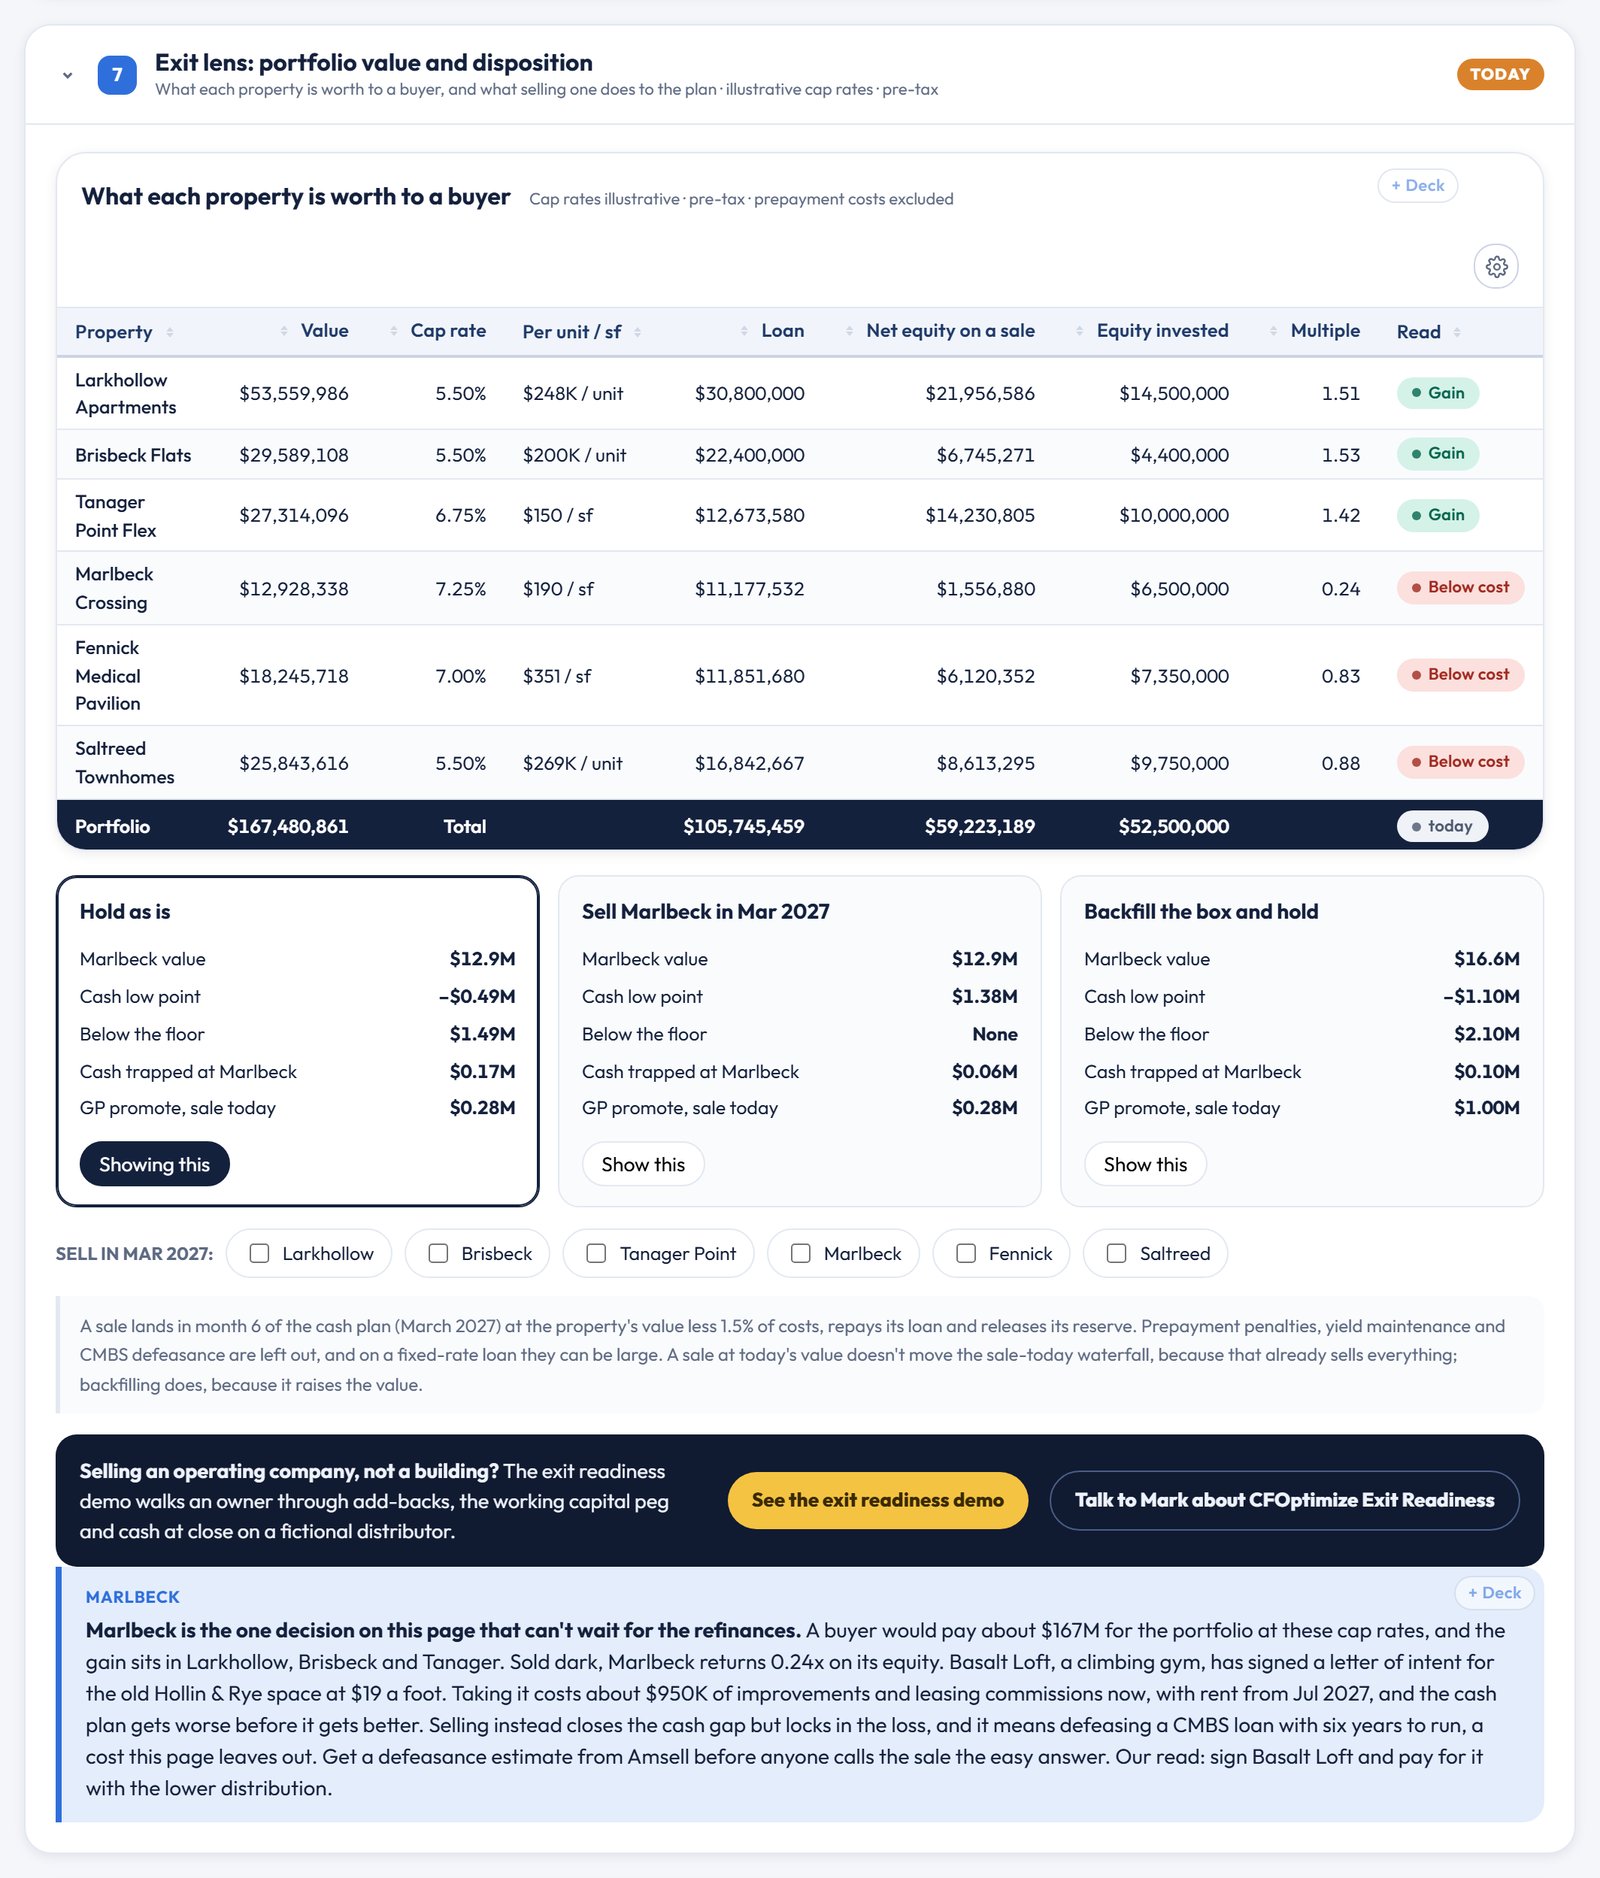
Sold dark today, Marlbeck would return 0.24x on its equity. Basalt Loft, a climbing gym, has signed a letter of intent for the old Hollin & Rye space at $19 a foot. Taking it costs about $950K of improvements and leasing commissions now, with rent from July 2027, and the cash plan gets worse before it gets better.
Selling instead closes the cash gap, but it locks in the loss, and it means defeasing a CMBS loan with six years to run. The page leaves that cost out on purpose, and it's the first number I'd ask Amsell for before anyone calls the sale the easy answer. My read is to sign Basalt Loft and pay for it with the lower distribution.
The switch, the levers and the investor deck
A switch at the top flips every section between the assumptions the fund was raised on and today's. On the underwriting terms, Brisbeck needs about $1.5M instead of $5.0M, the three refinances net $8.9M of cash out instead of $0.48M, and the sponsor's promote on a hypothetical sale is $7.3M instead of about $280K. The strip under the switch follows the refinance rate all the way through: drag it from 6.25% to 5.75% and the shortfall below the floor shrinks to about $0.5M, push it to 6.75% and it grows to about $2.4M. The rates and cap rates are illustrative, not quotes.

Every card, chart and table also has a + Deck button, and the quarterly investor update pack loads the set I'd bring to an LP advisory meeting or a lender: the scorecard, coverage by property, the consolidation, the maturity ladder, the cash plan, the waterfall and the exit lens. It downloads as an editable PowerPoint, with the assumptions recorded in the speaker notes.
Why not just do this yourself with AI?
You can do a lot of it yourself, and you should use AI. We use it every day. The analysis was never the hard part. Every finding above came from four things a chatbot doesn't have:
- Transaction-level data, kept current. Each property's ledger, the rent rolls, the reserve balances and the loan servicers' reporting, pulled automatically after every close and reconciled so seven sets of books add up to one.
- Context nobody wrote down. That Veyra's extension test is 1.30x, that Ostrey wants the roof escrowed, that a climbing gym signed an LOI on the dark box. We load the loan terms, covenants and major leases next to the numbers they explain.
- Somewhere safe to keep it. Read-only connections, a secured warehouse and access controls, instead of loan agreements and investor capital accounts pasted into a chat window.
- Someone accountable for it. A CFO who knows the loans well enough to say "hold the Tanager cash for June" and then stand behind it in front of the LPs and the lender.
Put those in place and the AI gets more useful too, because it's finally reading the right data.
What it takes to get this on your own numbers
We connect read-only to each property's books and the fund's, map every entity to one chart of accounts, and rebuild the history property by property. Then we put the loans, the reserves, the major leases, the capital accounts and the waterfall on top, so coverage, the maturity schedule, the cash plan and the LP report all come from the same numbers and refresh after every month-end close.
If you'd like to see that on your own portfolio, schedule a call with our team and we'll walk through your loans together. You can also browse the other demos in our showcase.
Haverlund Real Estate Partners, its fund, and every property, tenant and lender named in this post are fictional, and every figure is invented for illustration. Nothing here is drawn from any client's books, buildings or loans. Cap rates, refinance terms and waterfall terms are illustrative assumptions, not quotes or appraisals, and nothing here is tax, legal, lending or investment advice.
Share