Founders and finance leads of $5 to 25M employer health companies that sell on a per-employee-per-month price, and the benefits brokers, healthcare CPAs and investors who read their numbers.
Whether each employer contract earns what the price assumed, what utilization does to staffing and margin, and which budget belongs in front of the board.
The first diligence request a growth investor sends a care company that sells to employers on a per-employee price is rarely about revenue. It's a one-line ask for visits per member per month by contract, against the utilization each price assumed. Most founders I meet have never seen that table, because it doesn't live in the P&L. It lives in the eligibility files, the scheduling system and payroll, and somebody has to join them.
Paste the P&L into an AI and you'll get a fluent summary in thirty seconds: revenue up, margin slipping, watch your clinician costs. All true, and none of it says which contracts, why, or what to change before the renewal. That answer comes from the transactions underneath.
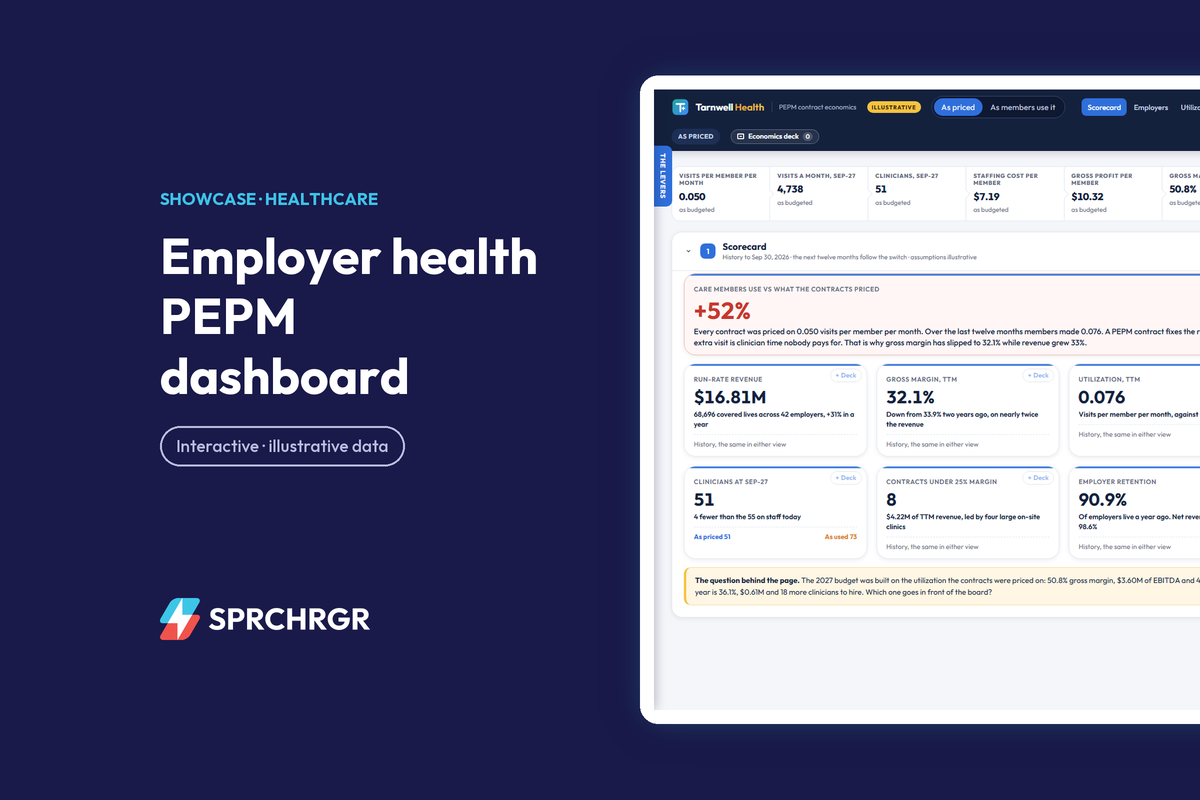
So here's how I'd walk a founder through a quarter using a working sample dashboard we built for a fictional worksite health company called Tarnwell Health. The company, the employers and the numbers are invented. The patterns aren't; I've seen each of them in real books. Open it in another tab and follow along.
The quarter in three sentences
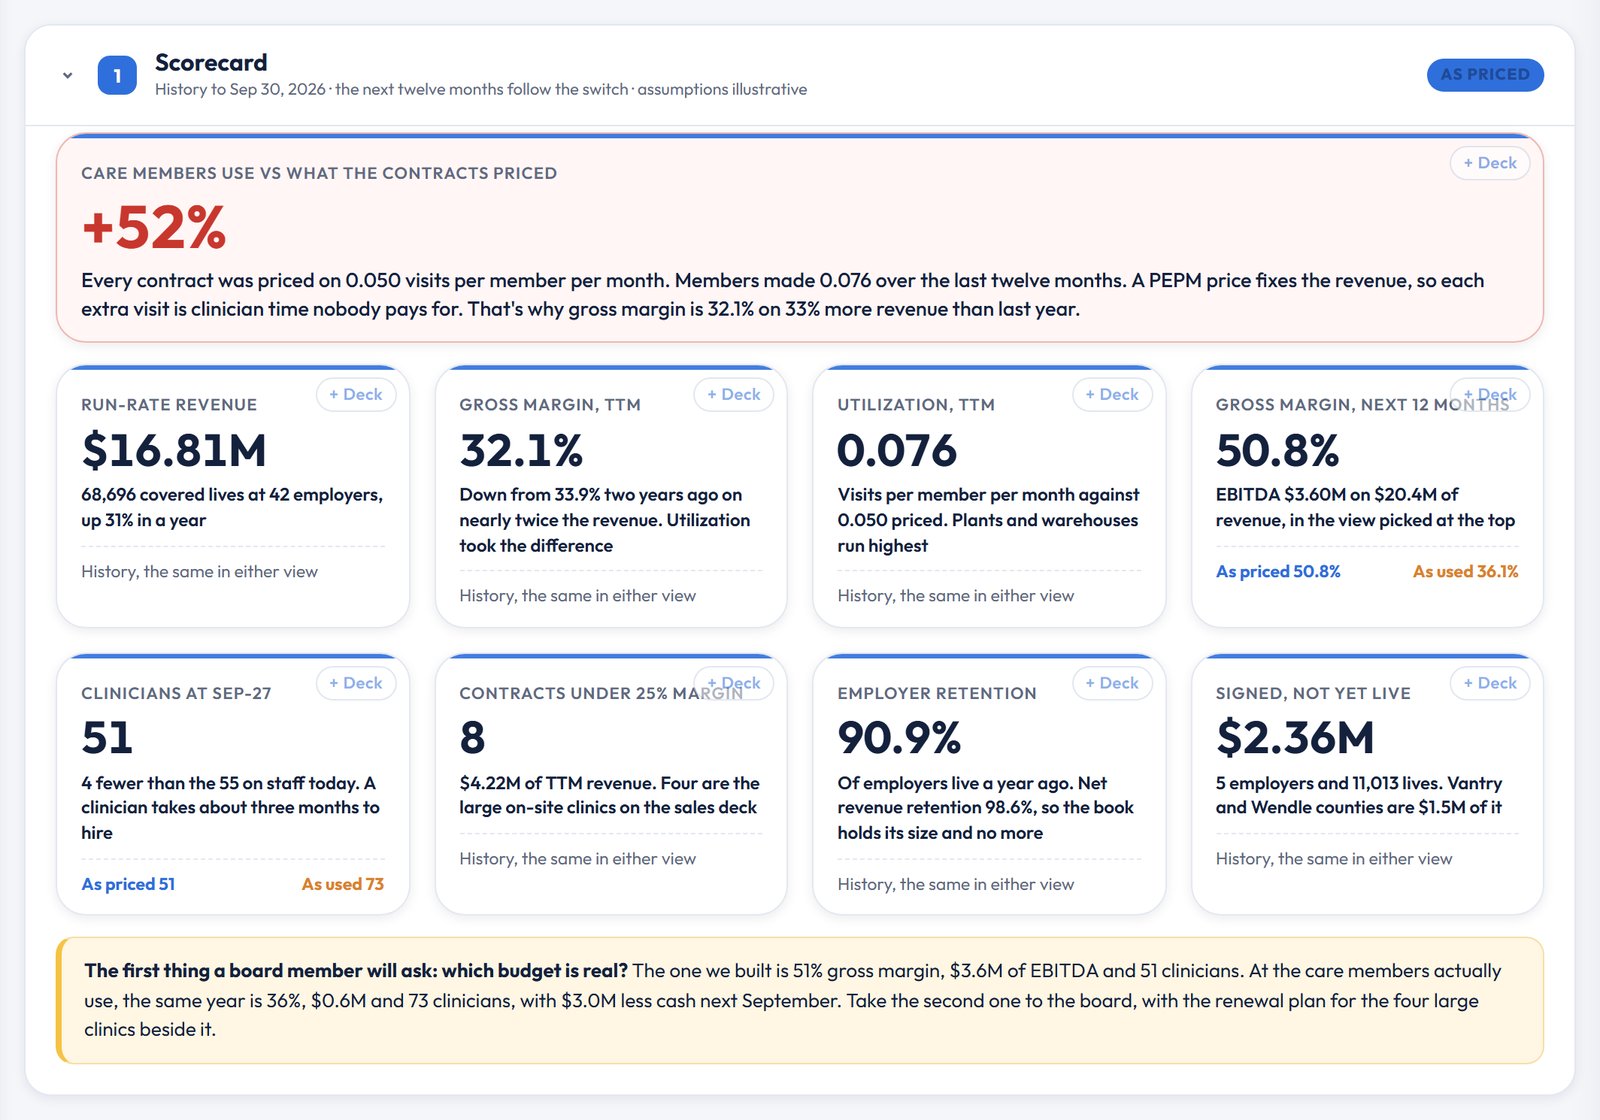
This is the paragraph at the top of the page, and it's the one I'd want the founder able to say to a board member without looking down:
Revenue was $4.0M from July through September, 30% more than a year ago, across 68,700 covered lives at 42 employers. Members made 0.077 visits a month against the 0.050 every contract was priced on, and gross margin for the quarter was 34%, no better than a year ago. We're rebuilding the 2027 budget on the care members actually use: 73 clinicians instead of 51, and about $0.6M of EBITDA, not $3.6M.
An AI summary of the same P&L gets the first sentence. The second needs the visit data matched to every contract's price. The third needs someone willing to tell the board the budget they approved was built on the wrong number.
The best-known logos earn the least
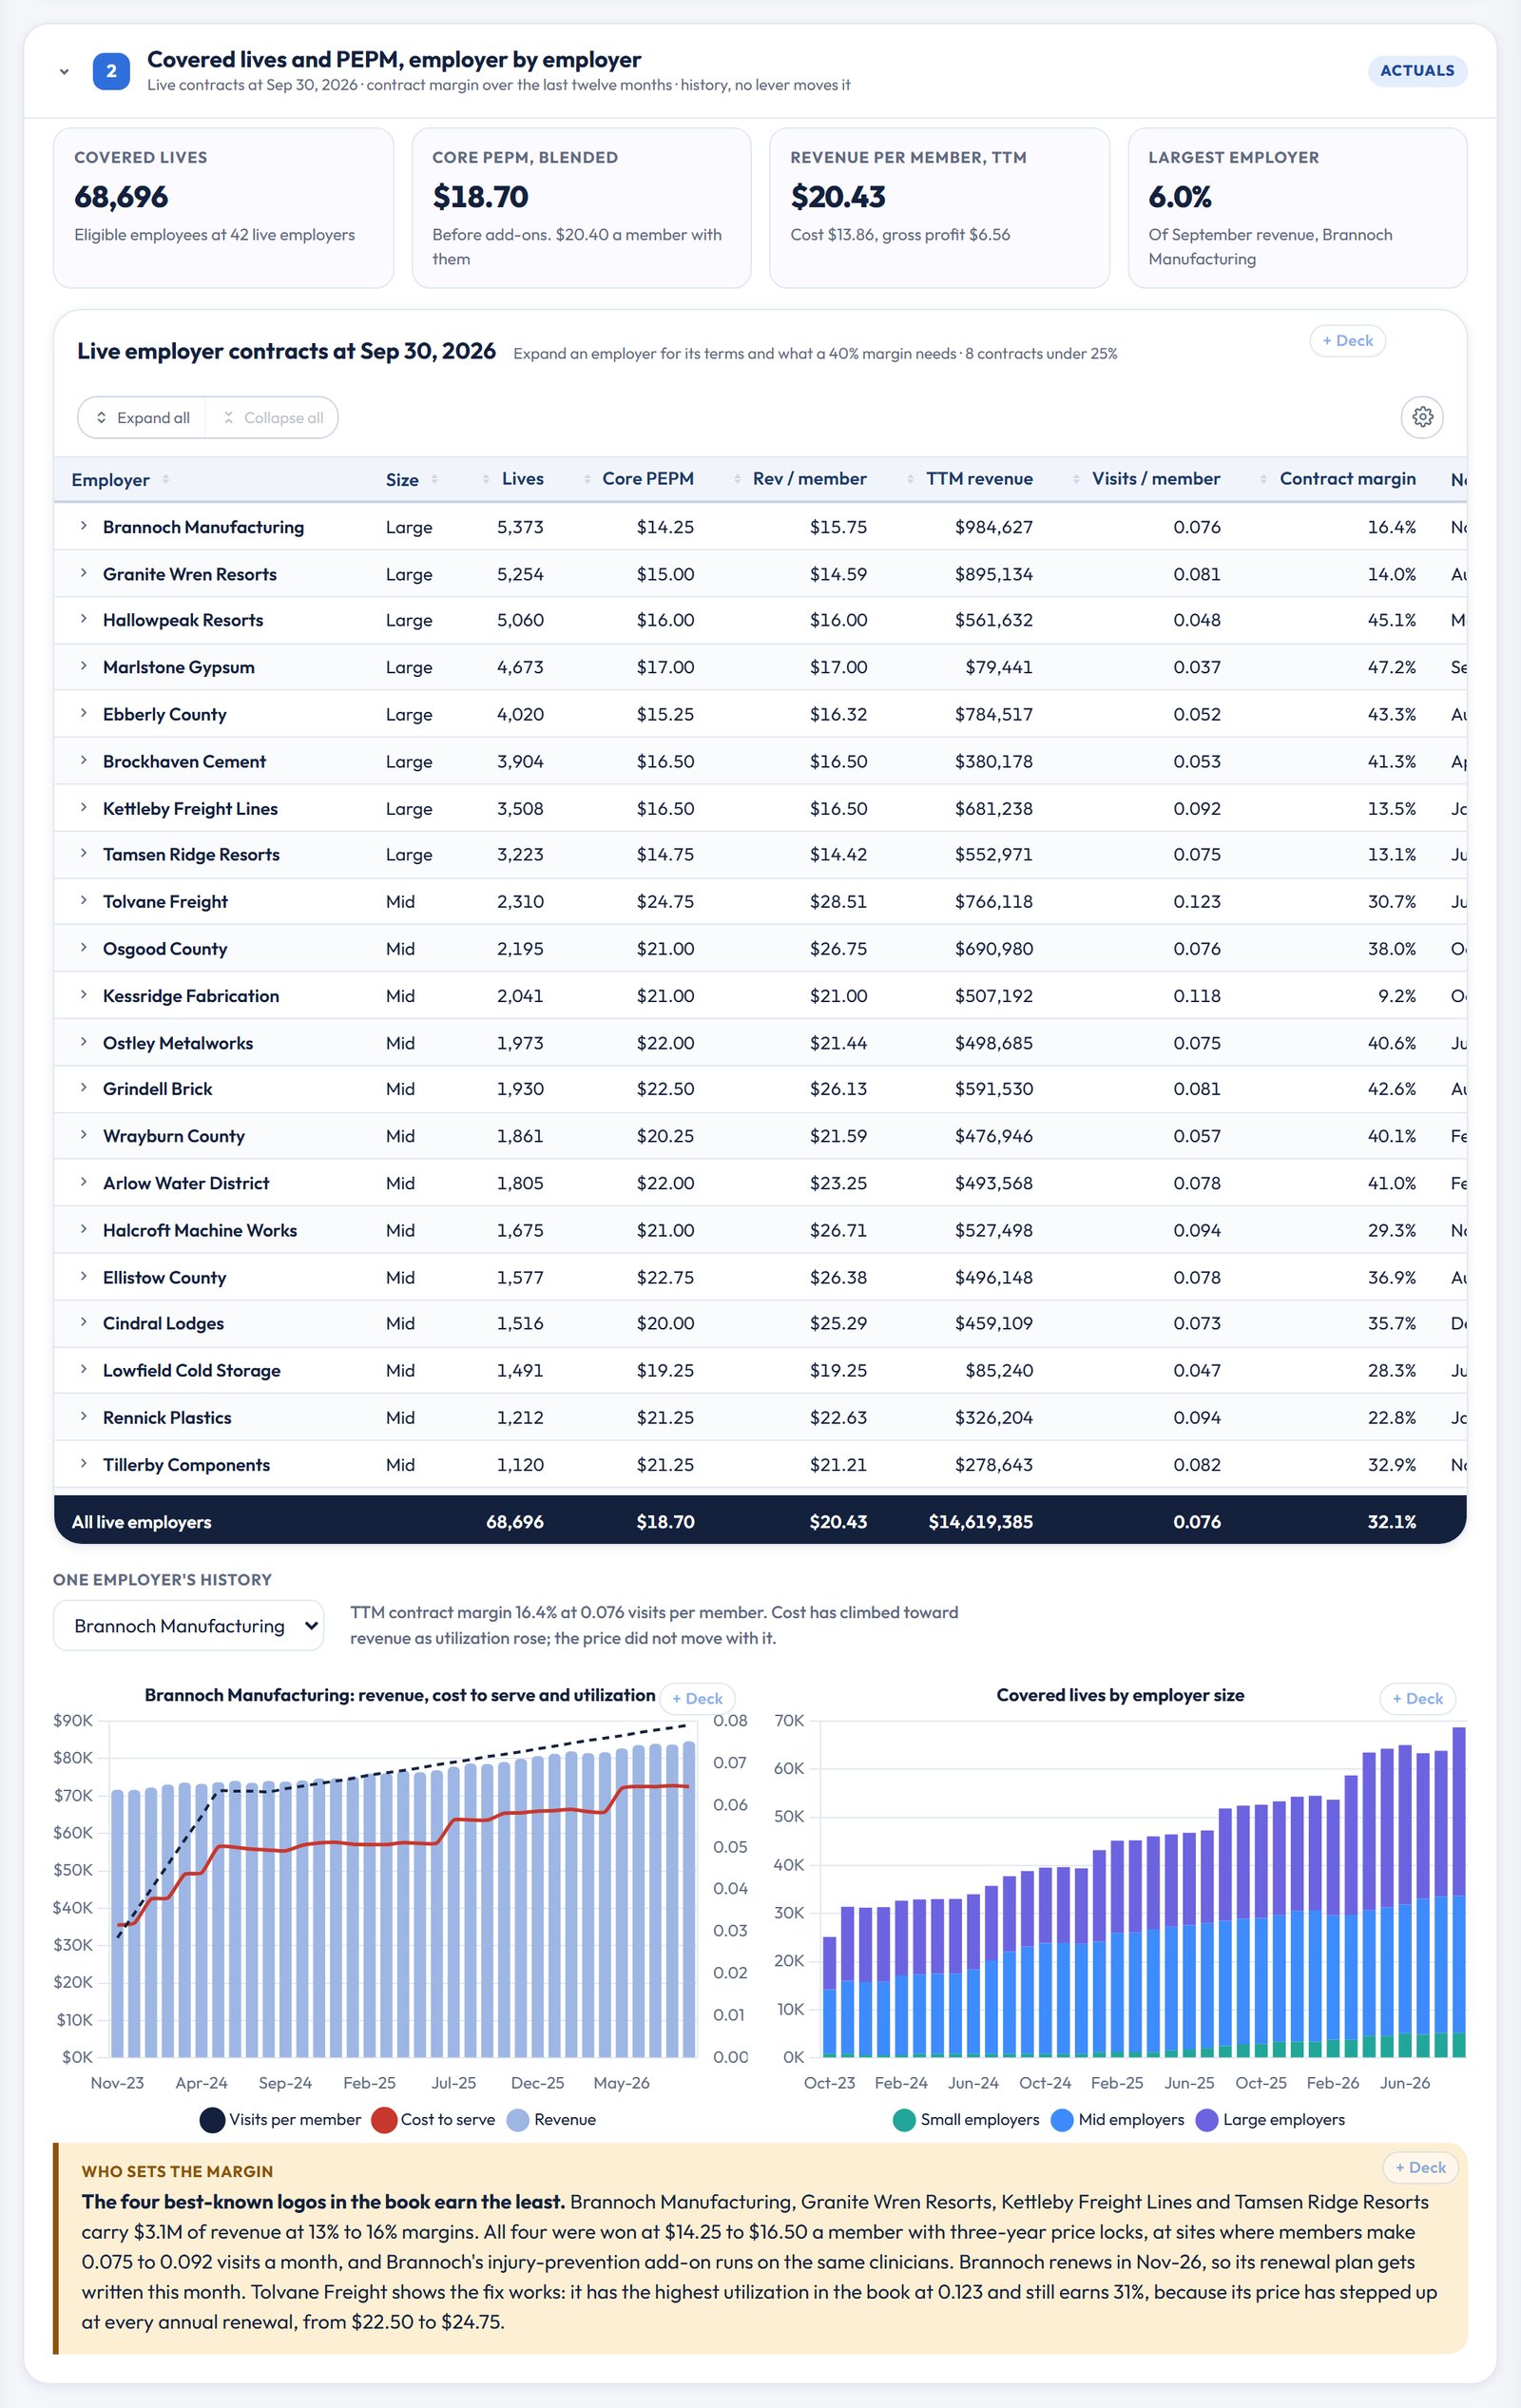
Sort the employer table by contract margin instead of revenue and the story changes. Brannoch Manufacturing, Granite Wren Resorts, Kettleby Freight Lines and Tamsen Ridge Resorts are the large on-site clinics on the sales deck. Together they carry $3.1M of revenue at 13% to 16% margins. All four were won at $14.25 to $16.50 a member with three-year price locks, at sites where members make 0.075 to 0.092 visits a month. Brannoch also bought the injury-prevention add-on, which runs on the same clinicians.
Brannoch renews in November. That renewal plan gets written this month, with Brannoch's own margin in it, not the blended one.
The proof that it can be fixed is in the same table. Tolvane Freight has the highest utilization in the book at 0.123 visits a month and still earns 31%, because its price stepped up at every annual renewal, from $22.50 to $24.75. Same kind of site, same kind of members, different contract terms.
Why a visit costs more than the price assumed
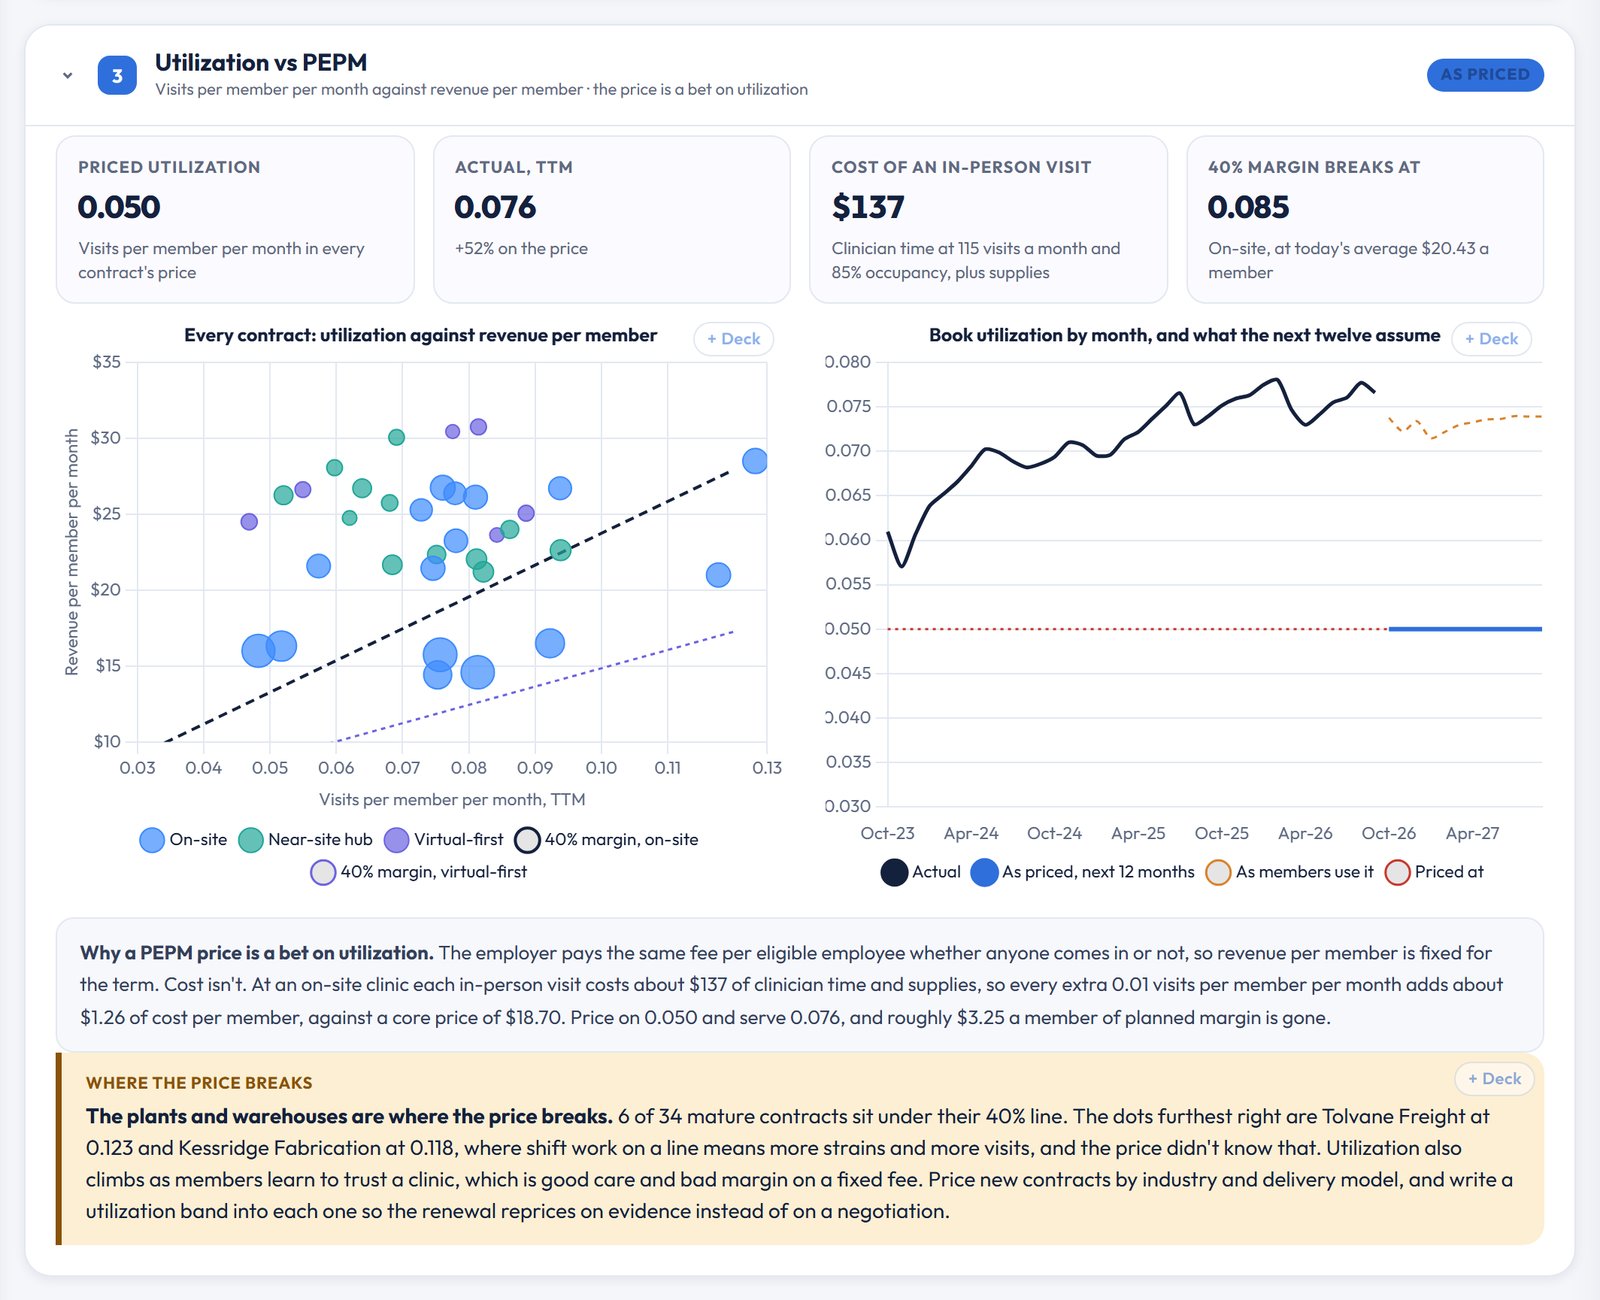
A PEPM price fixes revenue per member for the term. Cost doesn't stay fixed. At an on-site clinic an in-person visit costs about $137 of clinician time and supplies, so every extra 0.01 visits per member per month adds about $1.26 of cost per member against a core price near $18.70. Price on 0.050, serve 0.076, and roughly $3.25 a member of planned margin is gone.
The scatter shows where. The dots furthest right are plants and warehouses, Tolvane at 0.123 and Kessridge Fabrication at 0.118, where shift work on a line means more strains. The fix for new business is pricing by industry and delivery model, with a utilization band written into the contract so the renewal reprices on evidence.
The care team is where the margin is decided
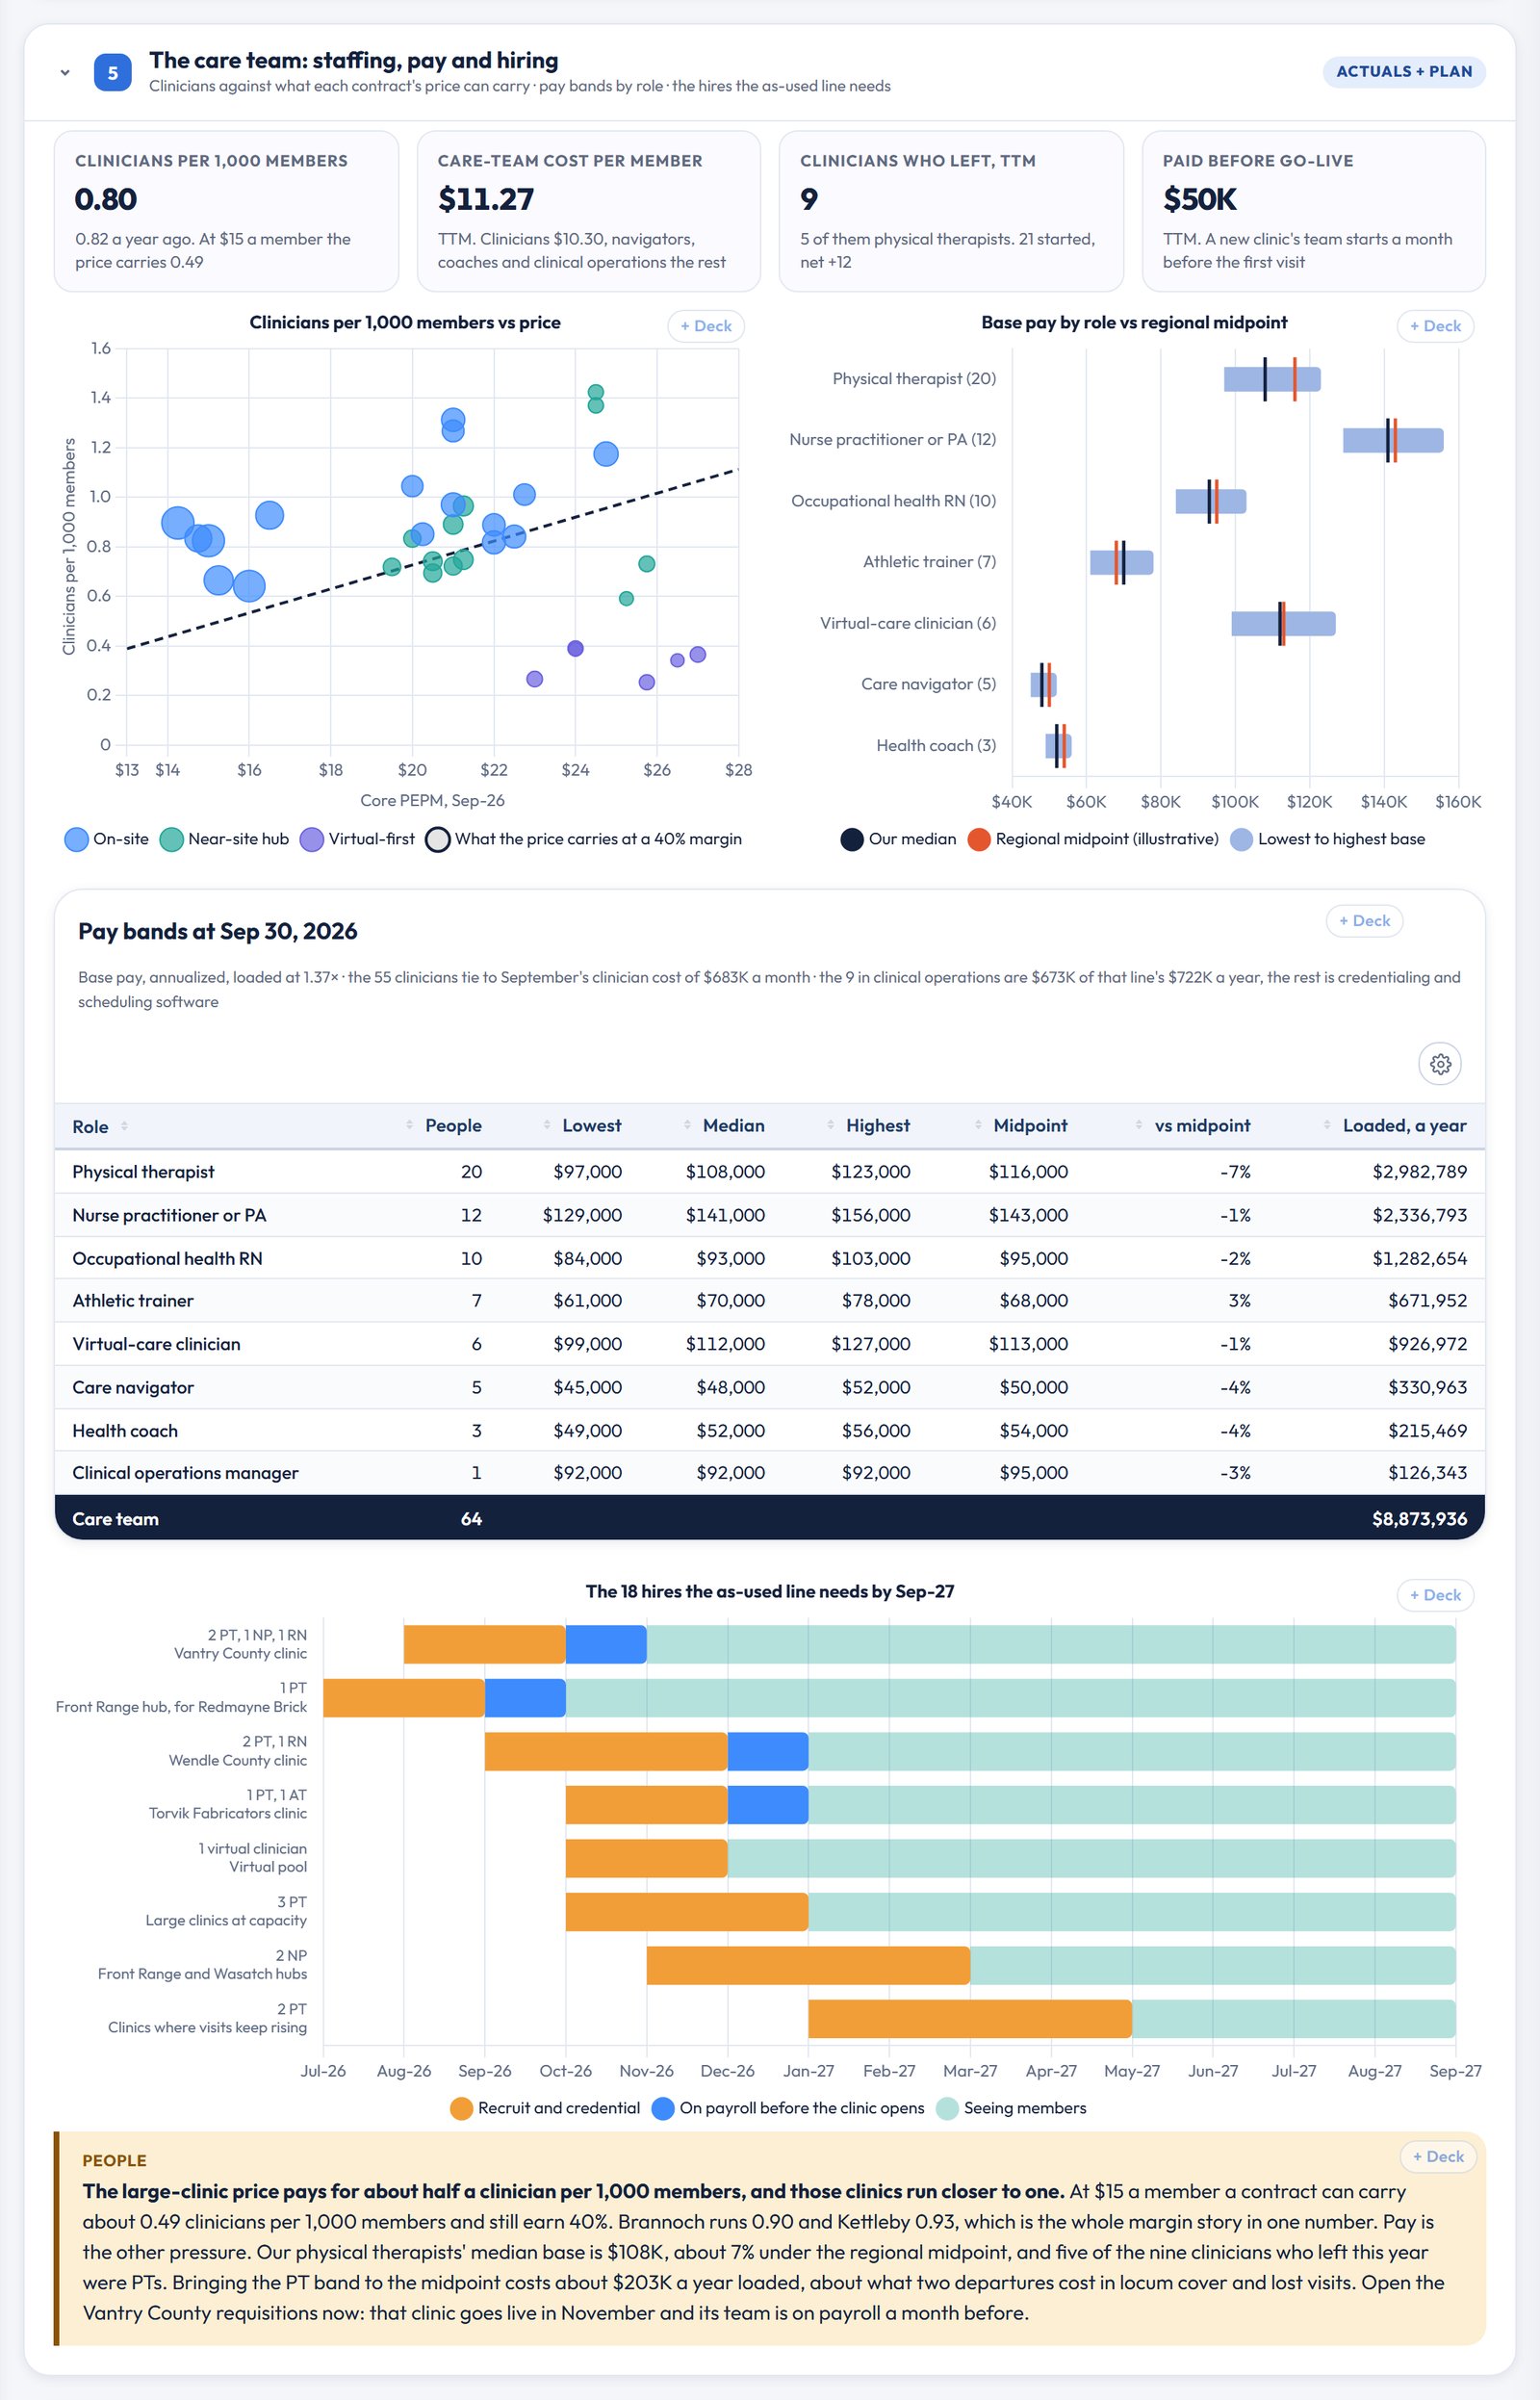
This is the section I added for this pass, and it's the one a summary of the financials can't produce, because it needs payroll matched to sites and sites matched to contracts. At $15 a member, a contract can carry about half a clinician per 1,000 members and still earn 40%. Brannoch runs 0.90 per 1,000. Kettleby runs 0.93. That's the whole margin story of the large clinics in one number, and it's a number an operations leader can manage.
The pay bands add the second pressure. Tarnwell's physical therapists sit at a $108K median base, about 7% under the regional midpoint, and five of the nine clinicians who left this year were PTs. Moving the PT band to the midpoint costs about $203K a year loaded, roughly what two departures cost in locum cover and visits that didn't happen. The 55 clinicians in that table tie to September's clinician cost on the P&L, so the band isn't a separate HR spreadsheet that disagrees with the books.
The hire timeline is the third piece. The as-used line needs 18 more clinicians by next September. Vantry County's clinic opens in November and its team goes on payroll a month before, so those searches should already be open. Wendle County and Torvik Fabricators follow in January.
Two budgets, one board meeting
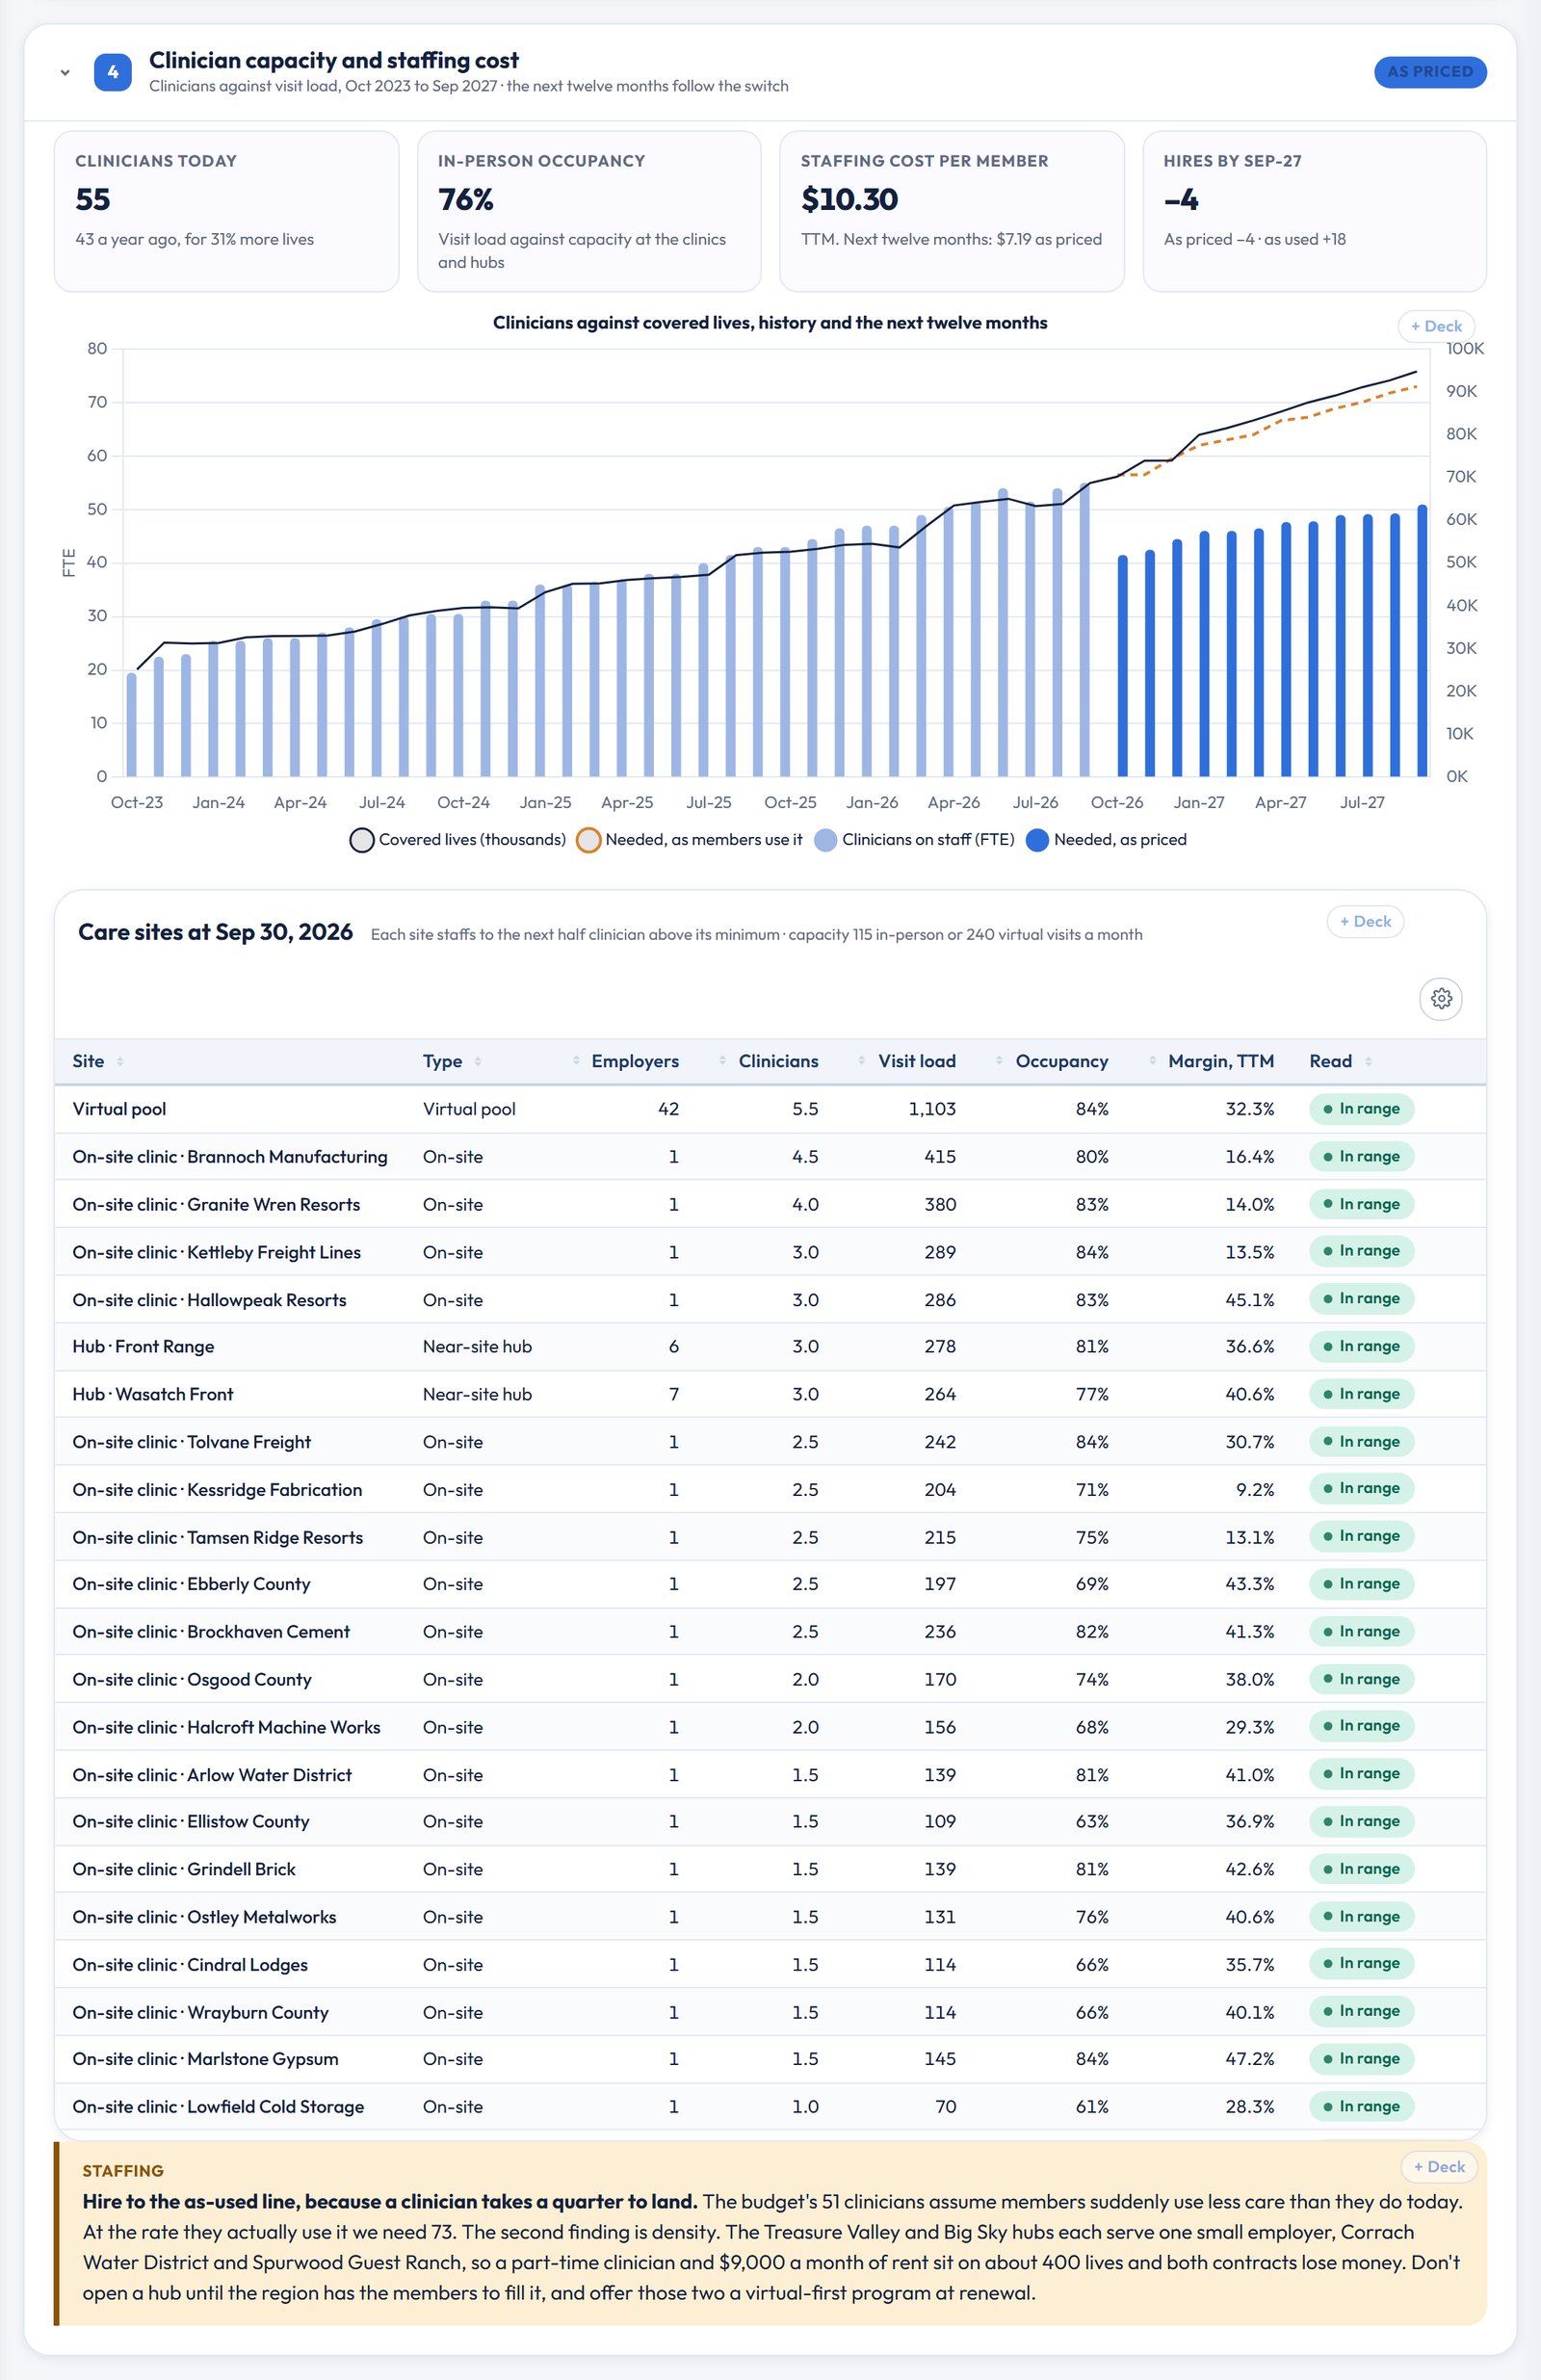
The switch at the top of the page flips the next twelve months between utilization as priced and utilization as members use it. As priced, 2027 is a 51% gross margin, $3.6M of EBITDA and 51 clinicians, four fewer than today. As used, it's 36%, $0.6M and 73 clinicians, with $3.0M less cash by next September. The strip under the switch follows that one change from visits per member all the way to "the 2027 budget: short".

The staffing section finds one more thing. The Treasure Valley and Big Sky hubs each serve a single small employer, Corrach Water District and Spurwood Guest Ranch. A part-time clinician and $9,000 a month of rent sit on about 400 lives each, and both contracts lose money. A virtual-first offer at renewal fixes both without losing either employer.
Renewals and payback
Retention is fine: 91% of employers live a year ago are still live, and net revenue retention is 99%. In the next twelve months 37 contracts worth $12.5M of run-rate revenue renew, and 7 of them run under 25%. The first is Kessridge Fabrication in October, at 9% on 0.118 visits a month. Getting it to 40% would take about 51% on the price. No escalator gets there, so that conversation is about scope and delivery model.
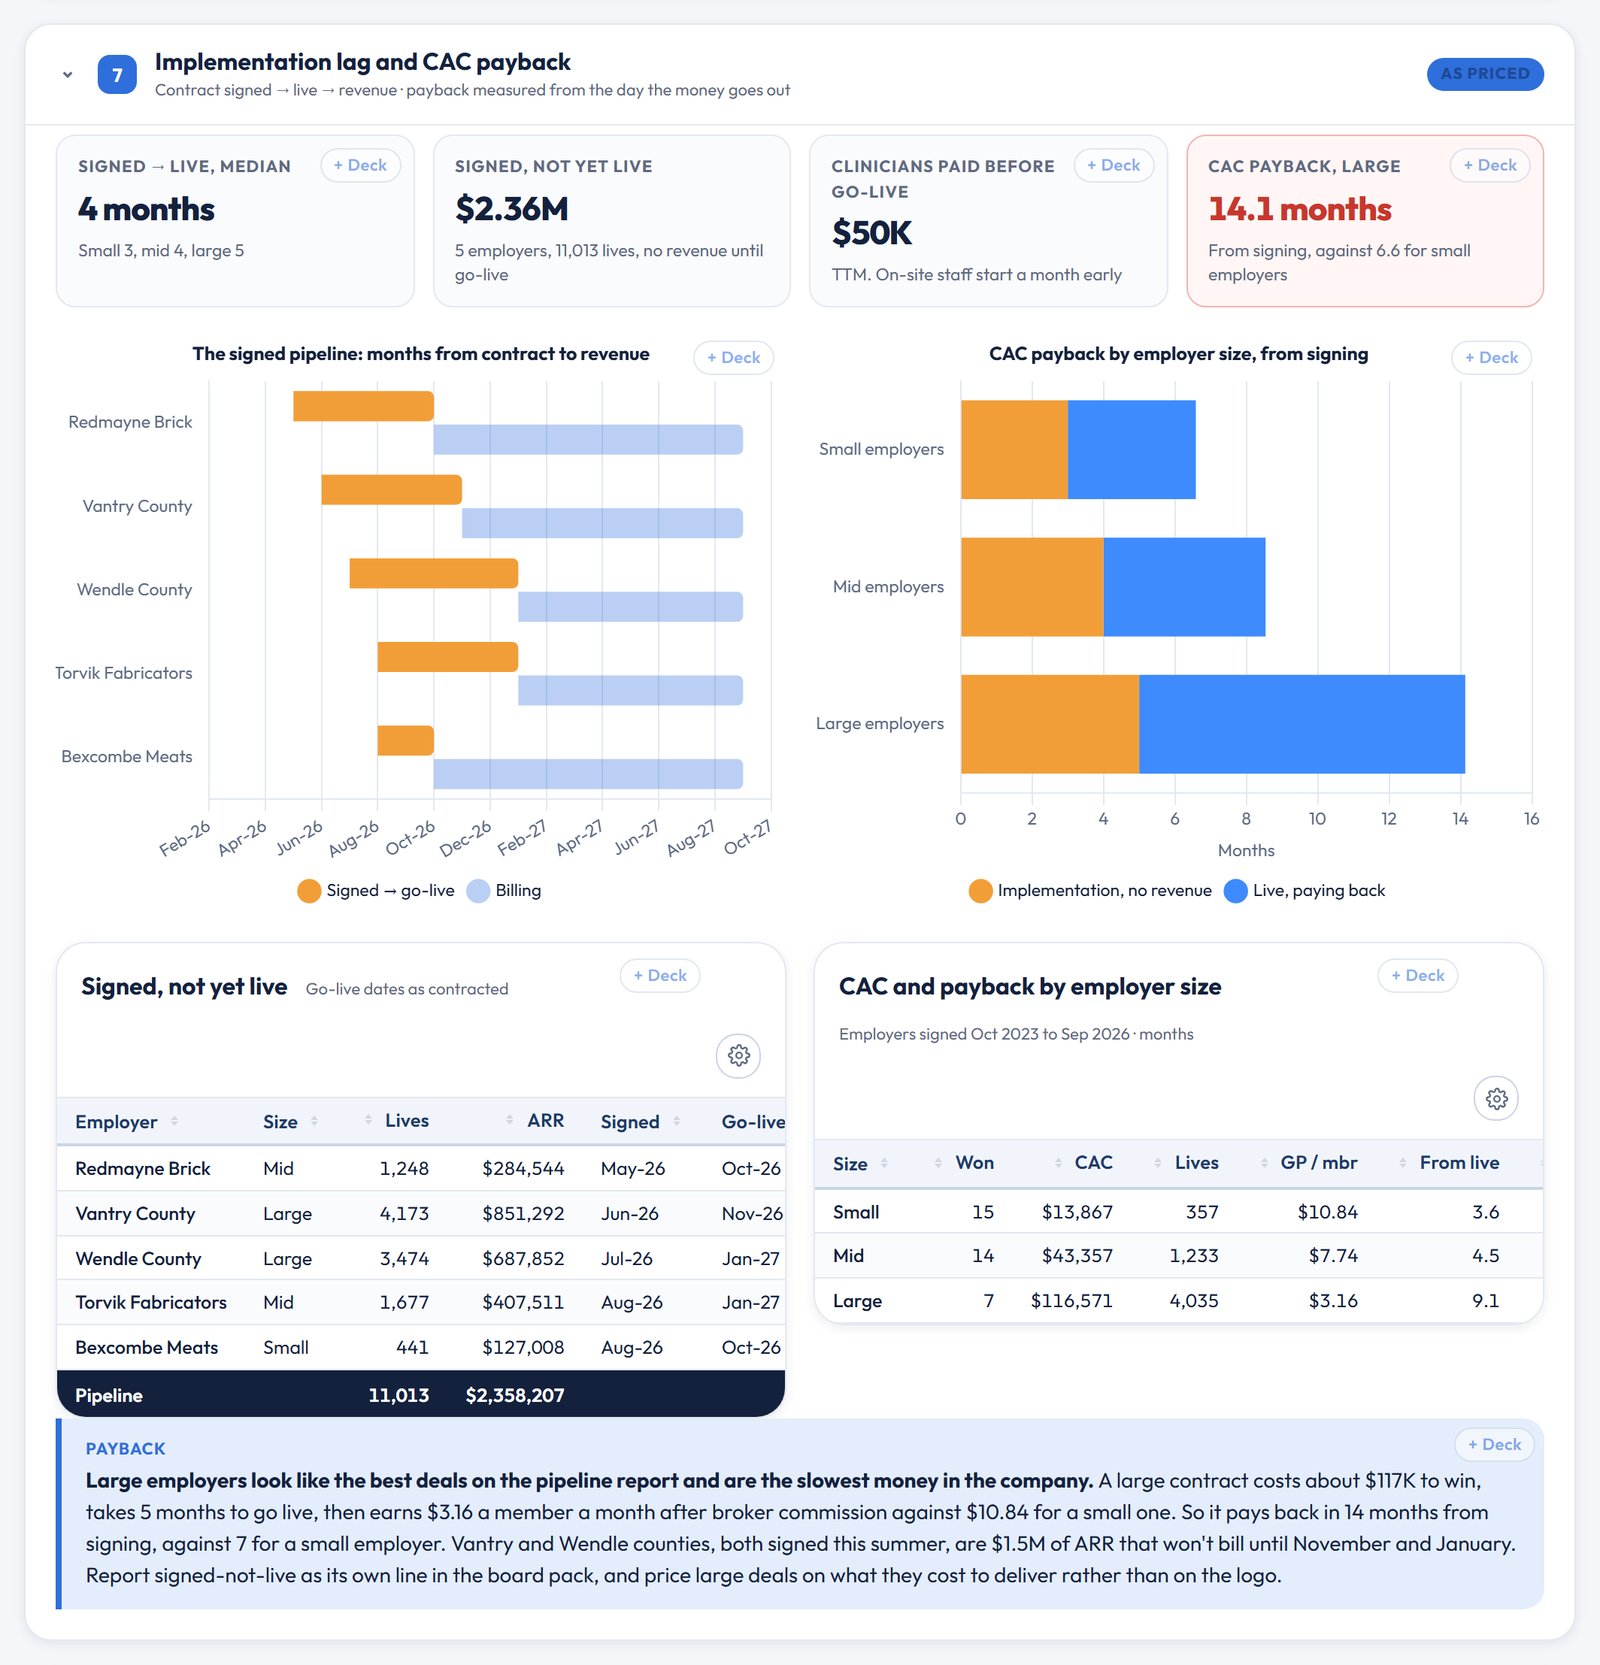
On the growth side, large employers are the slowest money in the company. A large contract costs about $117K to win, takes five months to go live and earns $3.16 a member a month after broker commission, so it pays back in about 14 months from signing against 7 for a small employer. Vantry and Wendle counties, both signed this summer, are $1.5M of ARR that won't bill until November and January. Signed-not-live belongs on its own line in the board pack.
What a buyer sees
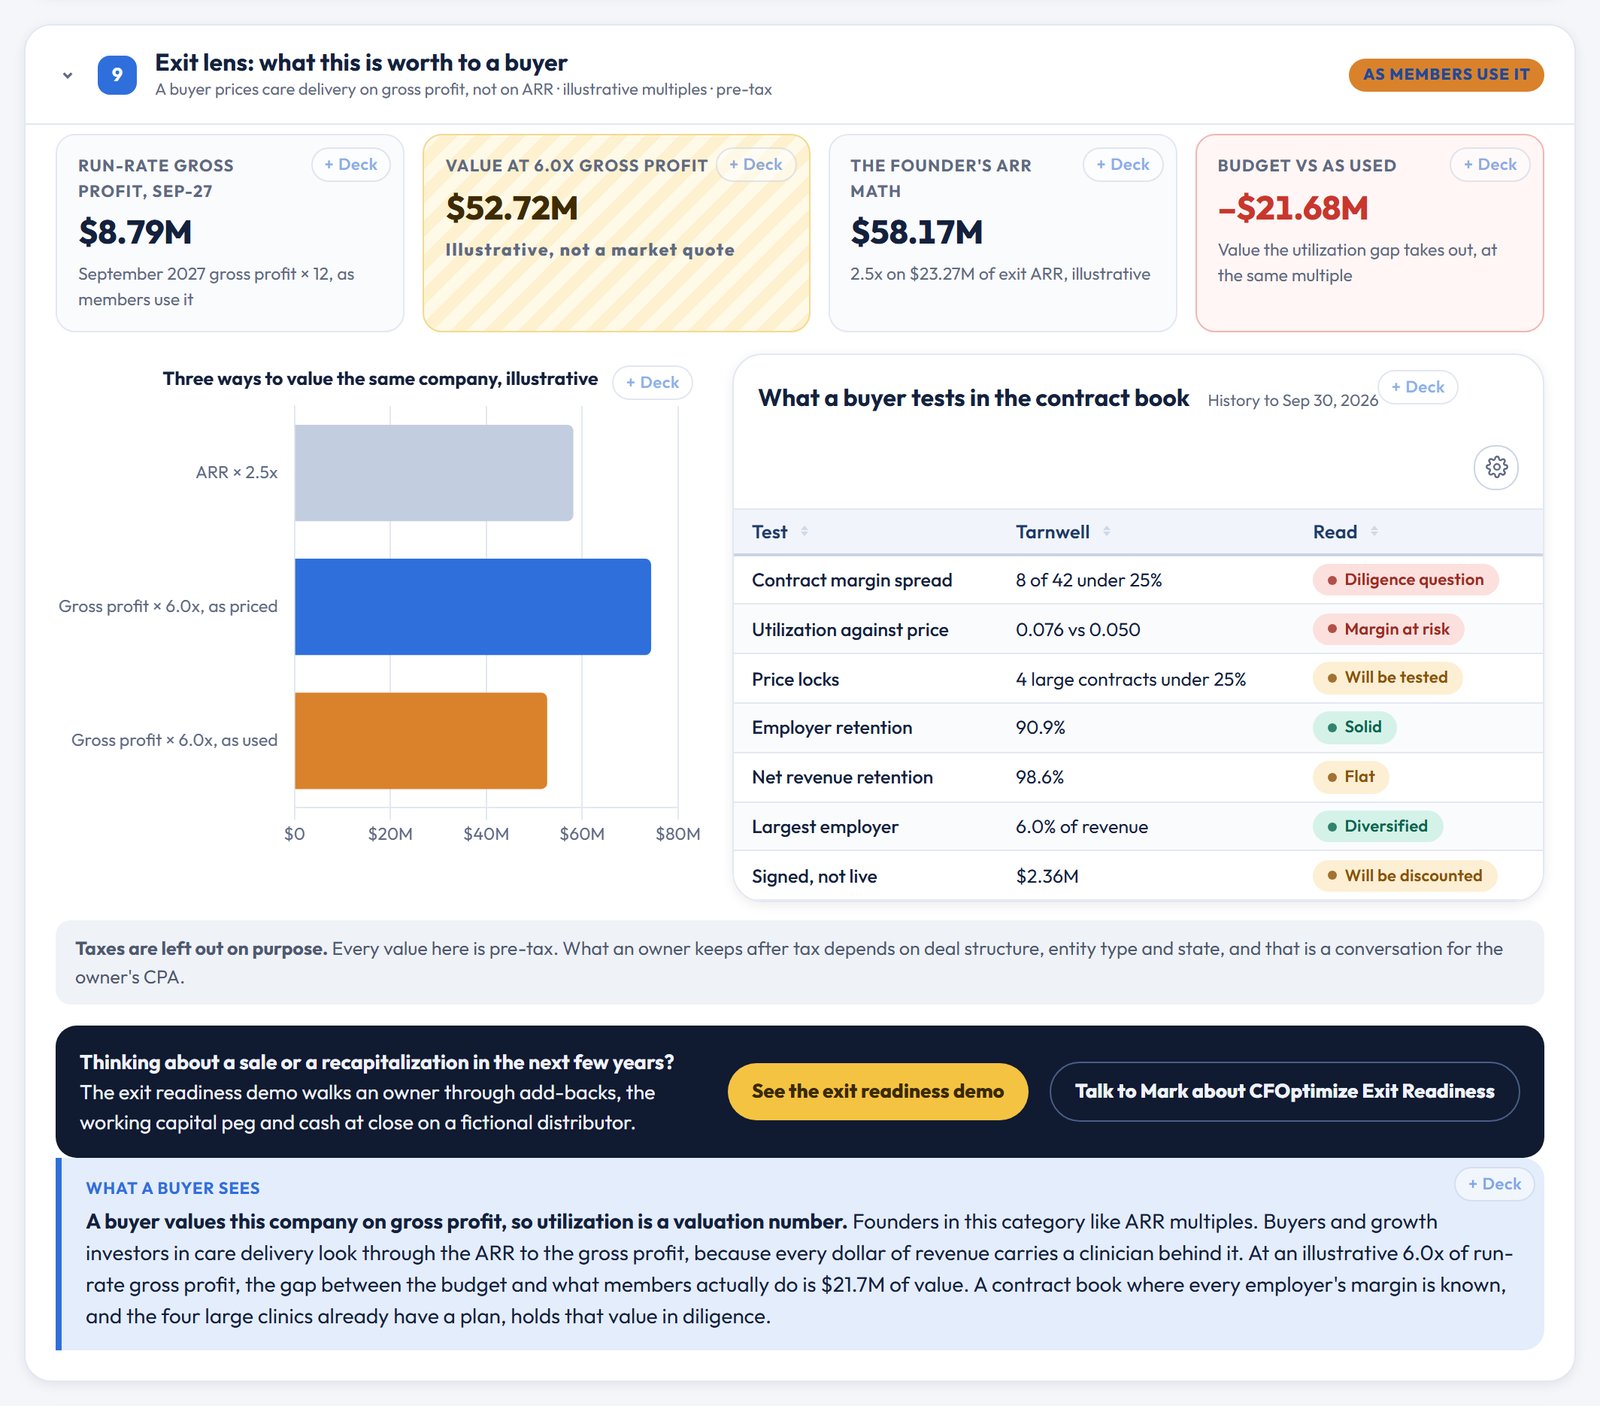
Buyers and growth investors in care delivery look through the ARR to the gross profit, because every dollar of revenue carries a clinician behind it. At an illustrative 6.0x of run-rate gross profit, the gap between the budget and what members actually do is $21.7M of value. A contract book where every employer's margin is known, and the four large clinics already have a plan, holds that value in diligence. If a sale or recapitalization is on the horizon, the exit readiness demo covers the rest.
The levers and the board deck
The levers on the left move the next twelve months while the 36 closed months stay locked: utilization, price on new contracts, the renewal escalator, repricing to a 40% margin with a cap, clinician cost, new lives a month and implementation time. Every card, chart and table has a + Deck button, and the employer economics pack builds an editable PowerPoint, with speaker notes recording which view and levers were active.
Why not just do this yourself with AI?
Use AI. We do, every day. But the analysis was never the hard part. Every finding above came from four things a chatbot doesn't have:
- Transaction-level data, kept current. Eligibility files, visits from the scheduling system, payroll by clinician and site, and the signed contract terms, pulled automatically after every close and reconciled so contract costs add back to the P&L.
- Context nobody wrote down. That Brannoch's add-on runs on the clinic's own staff, that a plant added a second shift, that a price lock runs to 2028. We add it to the data so it shows up beside the numbers it explains.
- Somewhere safe to keep it. Read-only connections, a secured warehouse and access controls, instead of member counts and clinician pay pasted into a chat window.
- Someone accountable for it. A CFO who will tell the board the approved budget is wrong, bring the renewal plan that fixes it, and stand behind both.
What it takes to get this on your own numbers
Nothing on this page needs special software on your side. We connect read-only to your accounting system, eligibility feeds, scheduling or EHR system and payroll, rebuild every contract's margin from your own lives, visits and staffing, and refresh it after every month-end close, so utilization drift shows up before the renewal and not after it.
That's CFOptimize – accelerate your growth, built for care companies that sell on a per-employee price. If you'd like to see it on your own contracts, grab time with me and we'll walk through your book together. You can also browse the other demos in our showcase.
Mark
Tarnwell Health and every employer, county and district named in this post are fictional, and every figure is invented for illustration. Nothing here is drawn from any client's books. The priced utilization, clinician capacity, pay midpoints, churn response and multiples are illustrative assumptions, not quotes or market data, and nothing here is clinical, actuarial, tax, legal or investment advice.
Share