Founders and CFOs of growing consumer brands that sell through distributors, a marketplace and their own site, heading into a seasonal inventory build with a lender conversation on the calendar.
What each channel keeps once every cost is loaded, how long each wholesale dollar sits before it comes back as cash, what a tariff does to the price you need, and what kind of money closes the summer gap.
When a growing beverage brand asks a bank for a line of credit, the first question usually isn't about sales. It's this: if sales are up 39%, why do you need the money? Most founders can feel the answer and can't prove it. An AI summary of the P&L won't prove it either, because the P&L says the year went well. The answer sits in distributor remittances, the deduction backup, the aging and the co-packer's run schedule.
So here's how I'd walk a founder through that conversation using a working sample dashboard we built for a fictional canned botanical soda company called Wrenfield Sparkling Co. The company, the distributors, the suppliers and the numbers are invented. The patterns aren't; I've seen every one of them in real books. Open it in another tab and follow along.
The spring in three sentences
This is the paragraph at the top of the page, written the way I'd want the founder to say it to the banker:
We sold $3.51M from February through April, 41% more than a year ago, and wholesale grew 65%. Cash still fell from $1.65M to $620K over the same three months, even with a $250K family loan in March, because $948K went into inventory for the summer and distributors owe us $517K more than they did in January. Left alone, cash goes below zero in June and bottoms out $884K short of our floor in July, so a $1.25M asset-based line has to be funding by the first week of June.
That answers the banker's question before it's asked. The growth is real, the cash went into receivables and inventory, and the founder already knows how big the hole is, when it opens and what closes it. An AI summary of the same statements gets the first sentence. The other two need the layer underneath.
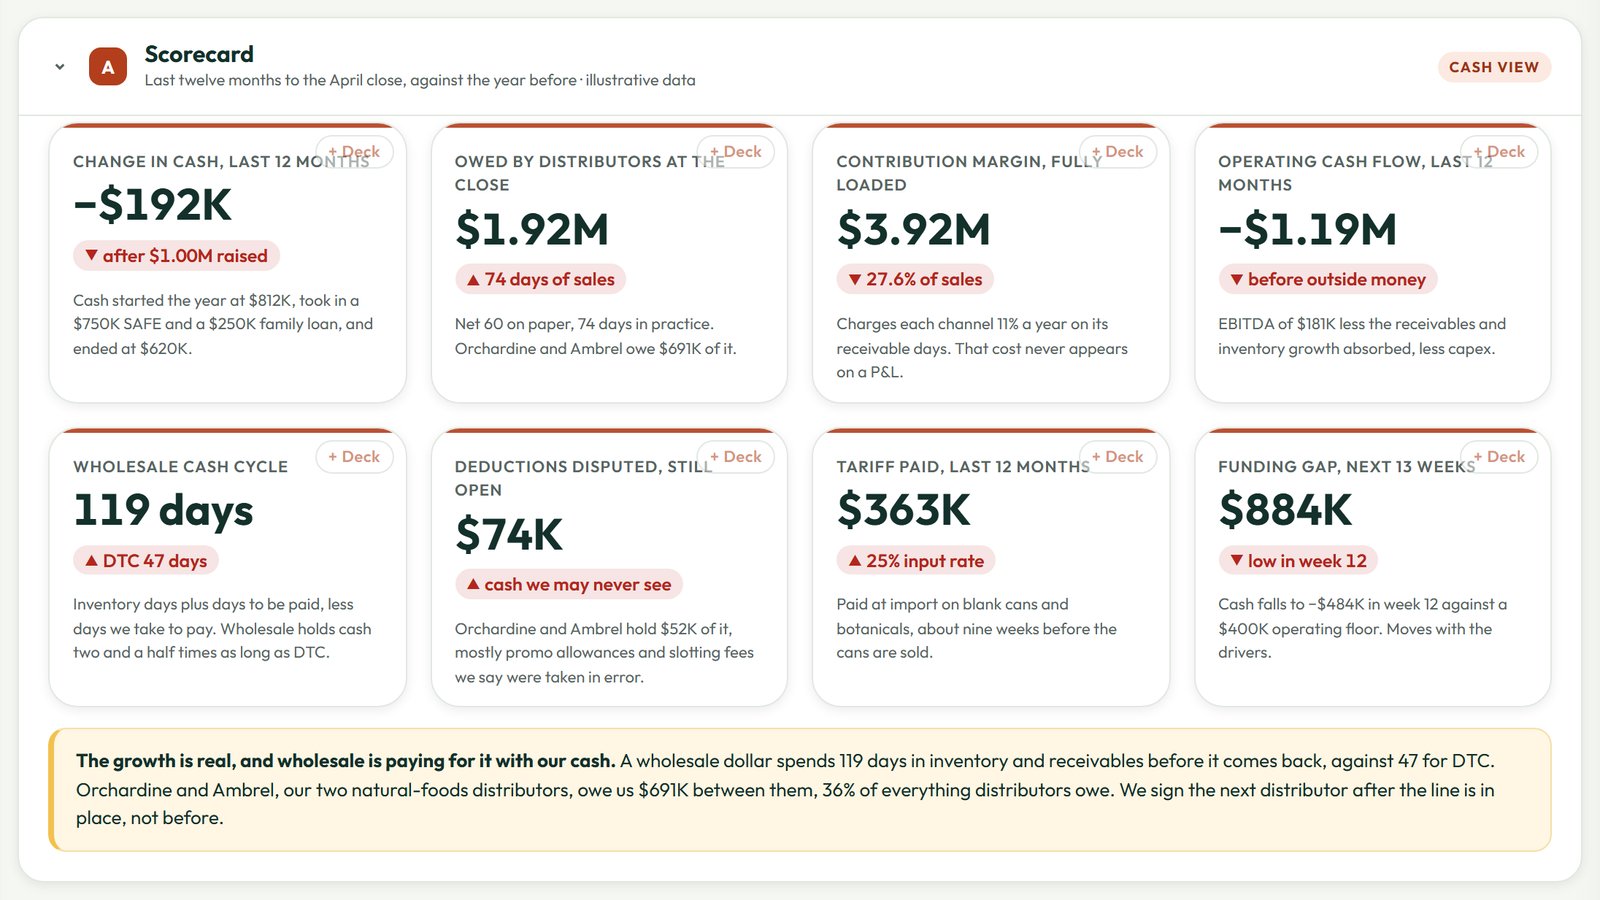
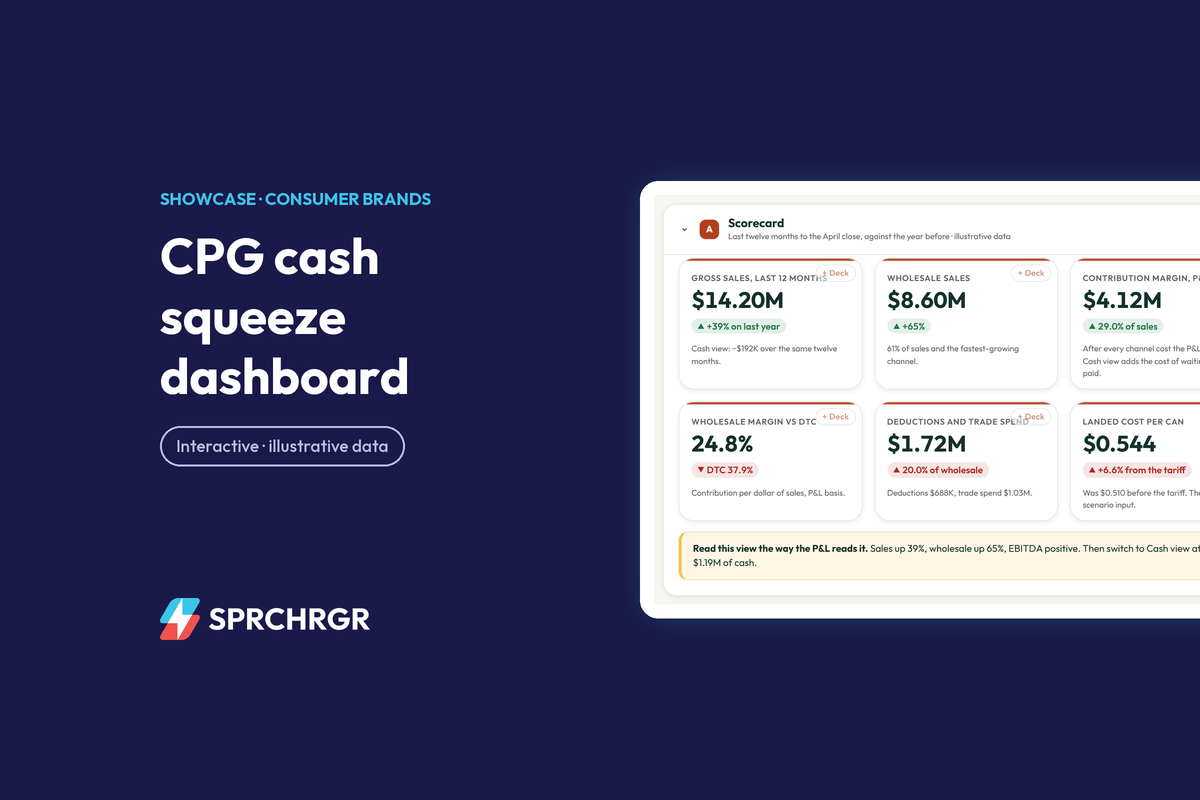
Flip the switch at the top of the page and every card changes from the way the P&L reads the year to the way the bank account does. Sales of $14.20M and positive EBITDA of $181K become $1.19M of cash used before the $750K SAFE and the family loan.
Name the distributors, because the lender will
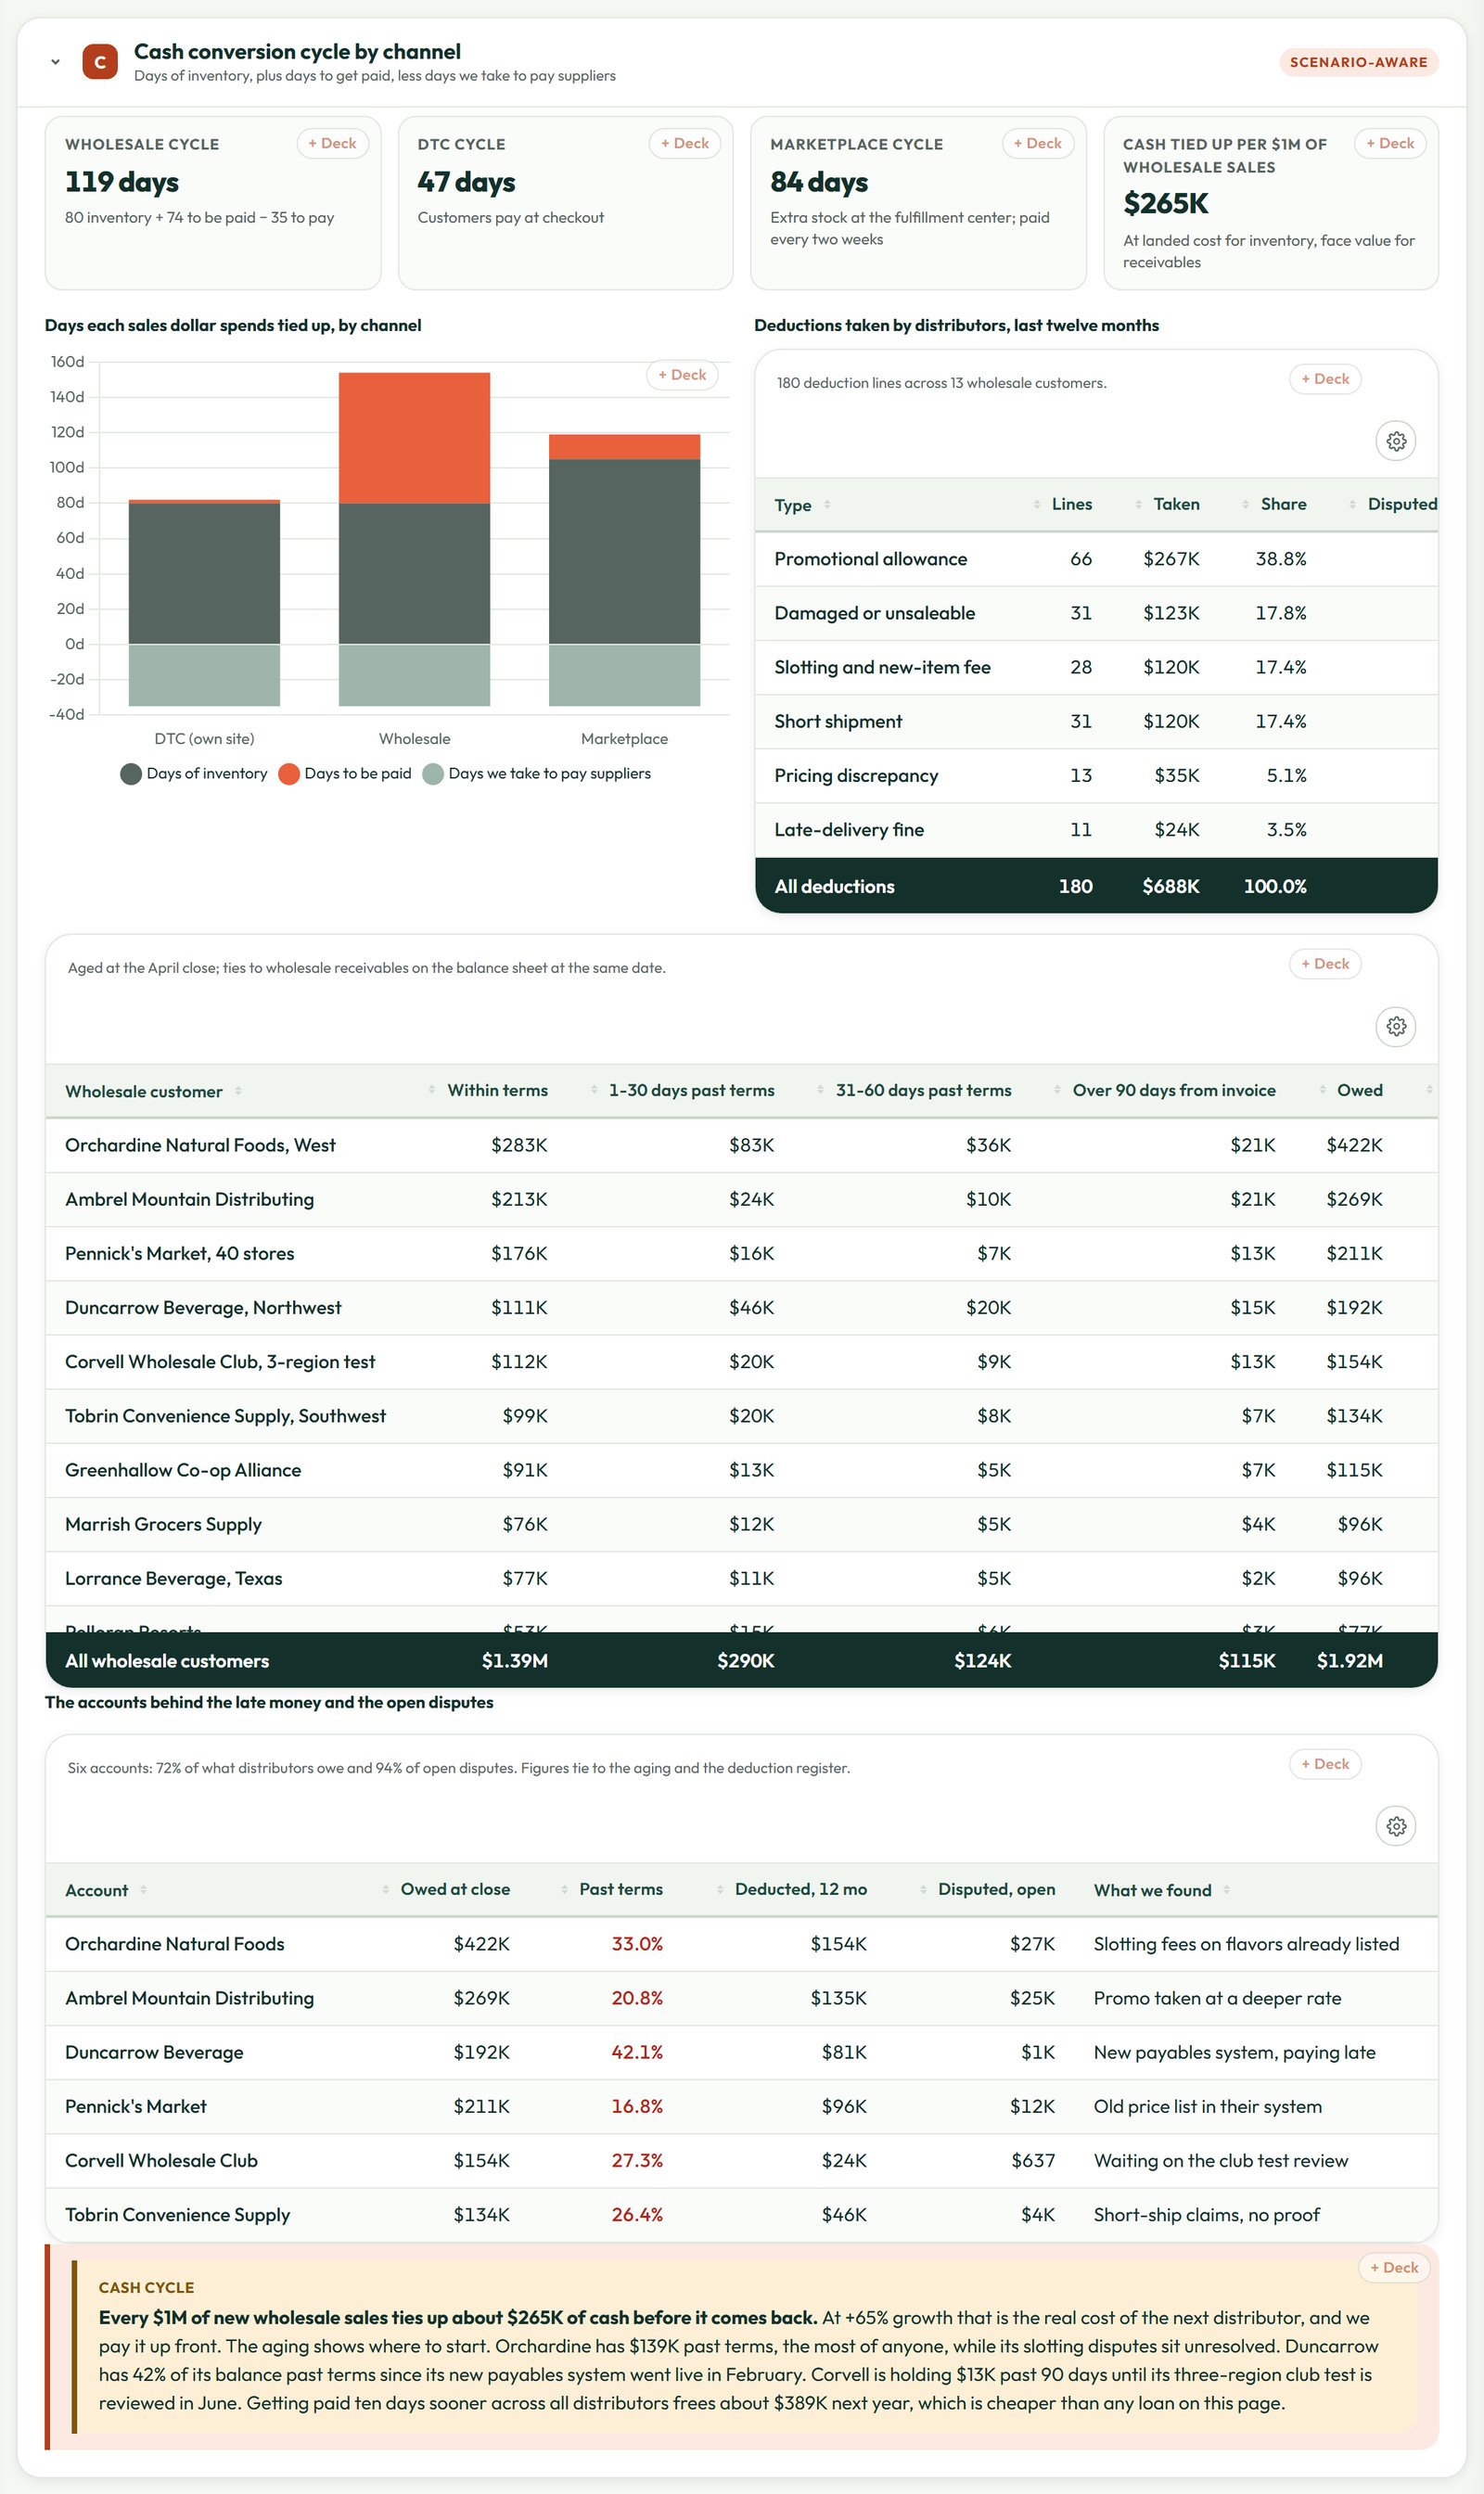
"Wholesale receivables are up" isn't something a lender can underwrite. So the cash cycle section has a table under the aging with the accounts that actually hold the late money and the open disputes. Six accounts make up 72% of what distributors owe and 94% of the deductions still in dispute.
- Orchardine Natural Foods is the largest account at $422K, and $139K of it is past terms, the most of anyone. Part of the reason is $27K of open disputes, mostly slotting fees deducted for flavors that were already on shelf.
- Ambrel Mountain Distributing deducted its spring promotion at a deeper rate than the one it agreed to. Between them, Orchardine and Ambrel hold $52K of the $74K still in dispute.
- Duncarrow Beverage has 42% of its balance past terms. Nothing is wrong with the account. Its new payables system went live in February, and nobody on Wrenfield's side had picked up the phone about it.
None of that is visible in a summary of the financial statements. It comes from matching each remittance to its invoices, the promo calendar and the proof of delivery. That matching is also where money comes back: distributors took $688K off their payments this year, and Wrenfield won $115K of it back by sending the backup. Done weekly instead of at quarter end, that's the cheapest working capital in the business.
Why wholesale earns less, and the part you control
Wholesale is 61% of sales and only half of contribution. Some of that is just price: a wholesale case sells for $13 against $26 on Wrenfield's own site, so the can is twice as big a share of every dollar. The part the team controls is deductions and trade spend, which take 20% of wholesale sales. Every $1M of new wholesale sales also ties up about $265K of cash before it comes back. That's the real cost of the next distributor, and it's paid up front. Getting paid ten days sooner across all distributors would free about $389K next year, which is cheaper than any loan on the page.
Where the summer gap comes from
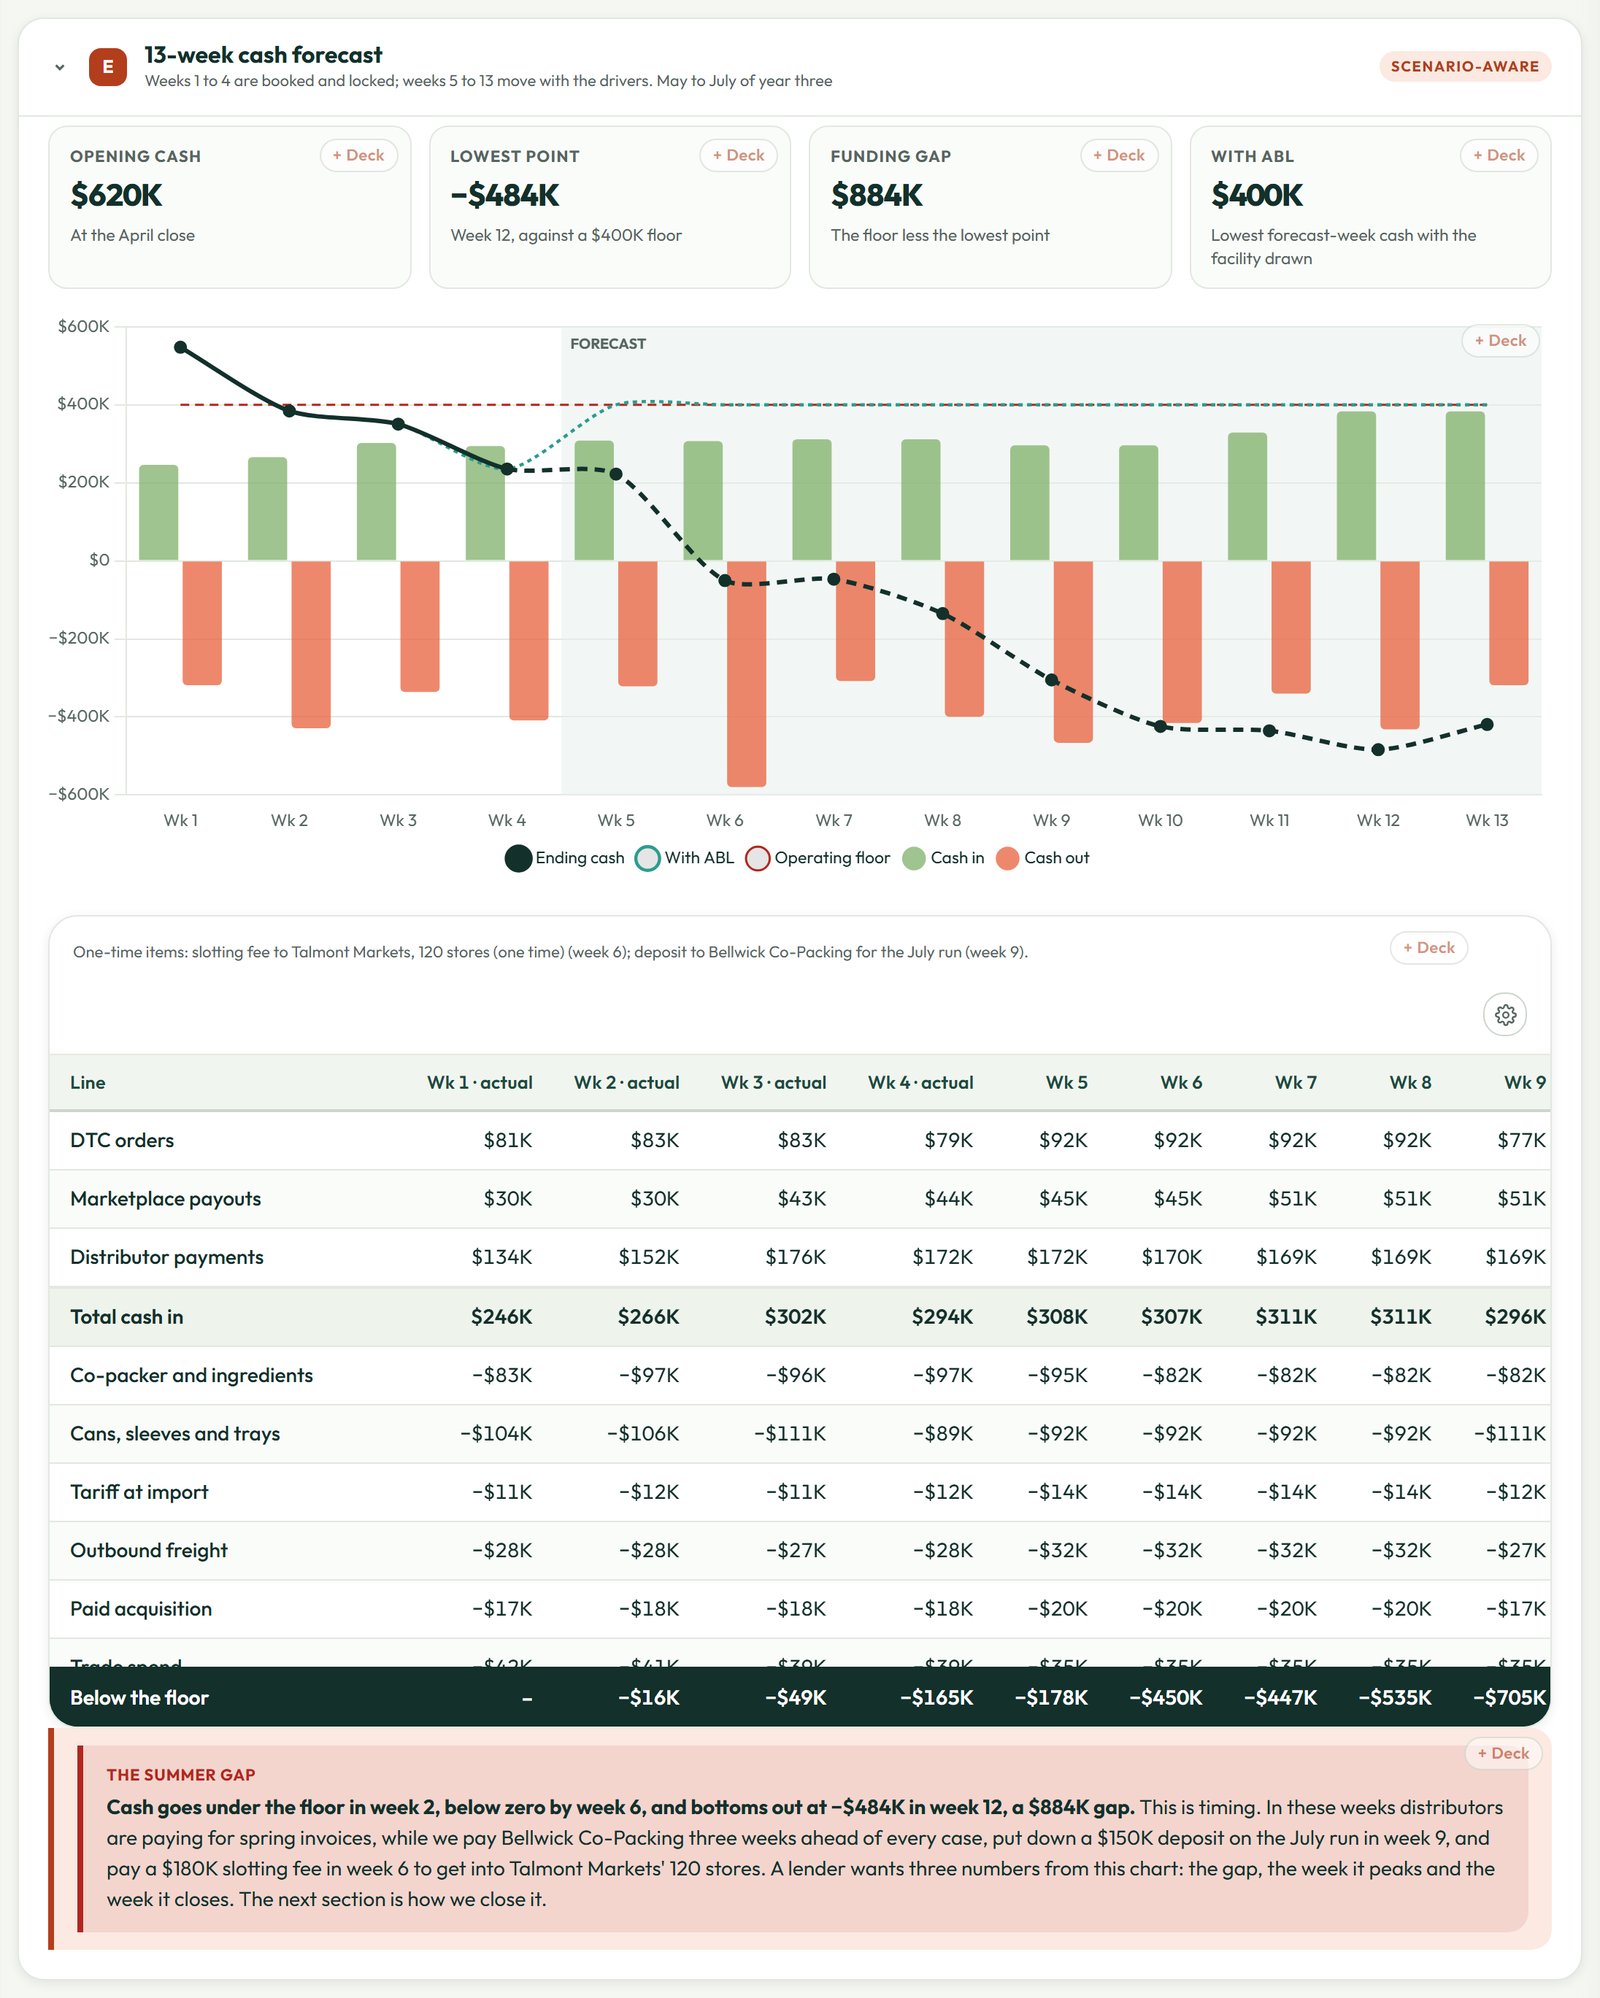
The 13-week forecast opens at the April close with $620K. Cash goes under the $400K operating floor in week 2, below zero by week 6, and bottoms out at −$484K in week 12, an $884K gap. This is timing, and the forecast names it. Distributors are paying for spring invoices while Wrenfield pays Bellwick Co-Packing three weeks ahead of every case, puts down a $150K deposit on the July run, and pays a $180K slotting fee to get into Talmont Markets' 120 stores.
Which money fits the gap
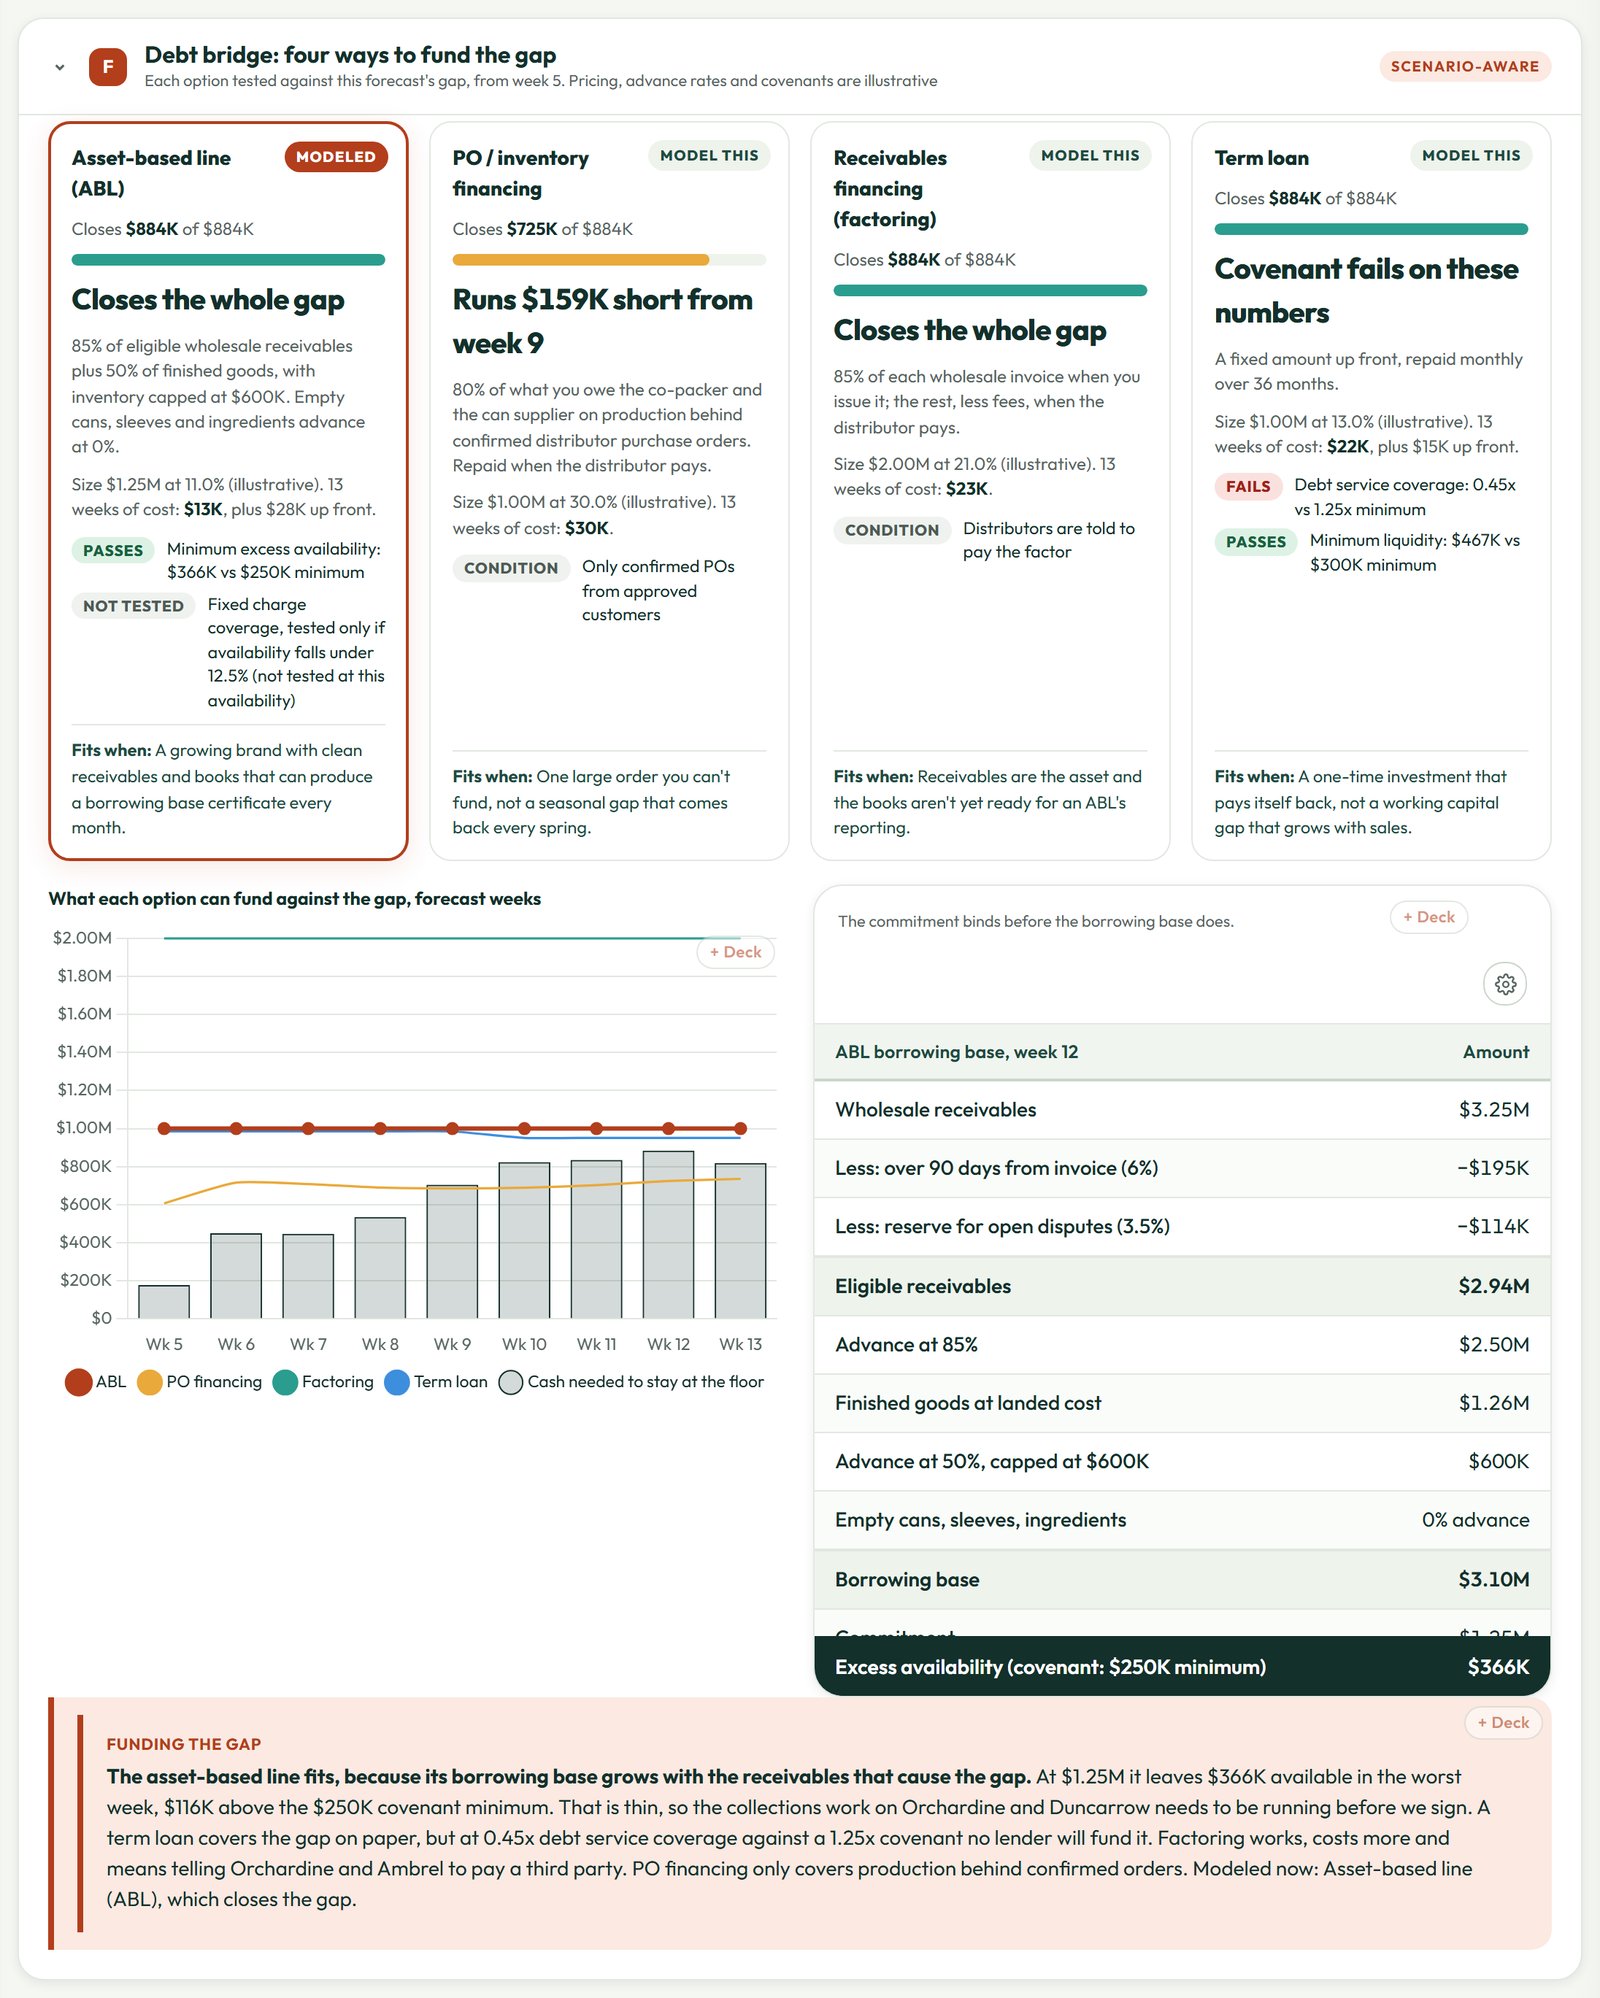
The debt bridge tests four kinds of financing against that forecast. The asset-based line fits, because its borrowing base grows with the same receivables that cause the squeeze. At $1.25M it closes the gap and leaves $366K available in the worst week, $116K above a $250K covenant minimum. That's thin, which is why the collections work on Orchardine and Duncarrow has to be running before the line is signed. A term loan covers the gap on paper, but at 0.45x debt service coverage against a 1.25x covenant no lender will fund it. Factoring works, costs more, and means telling Orchardine and Ambrel to pay a third party.
The tariff, the price letter and what a buyer pays for
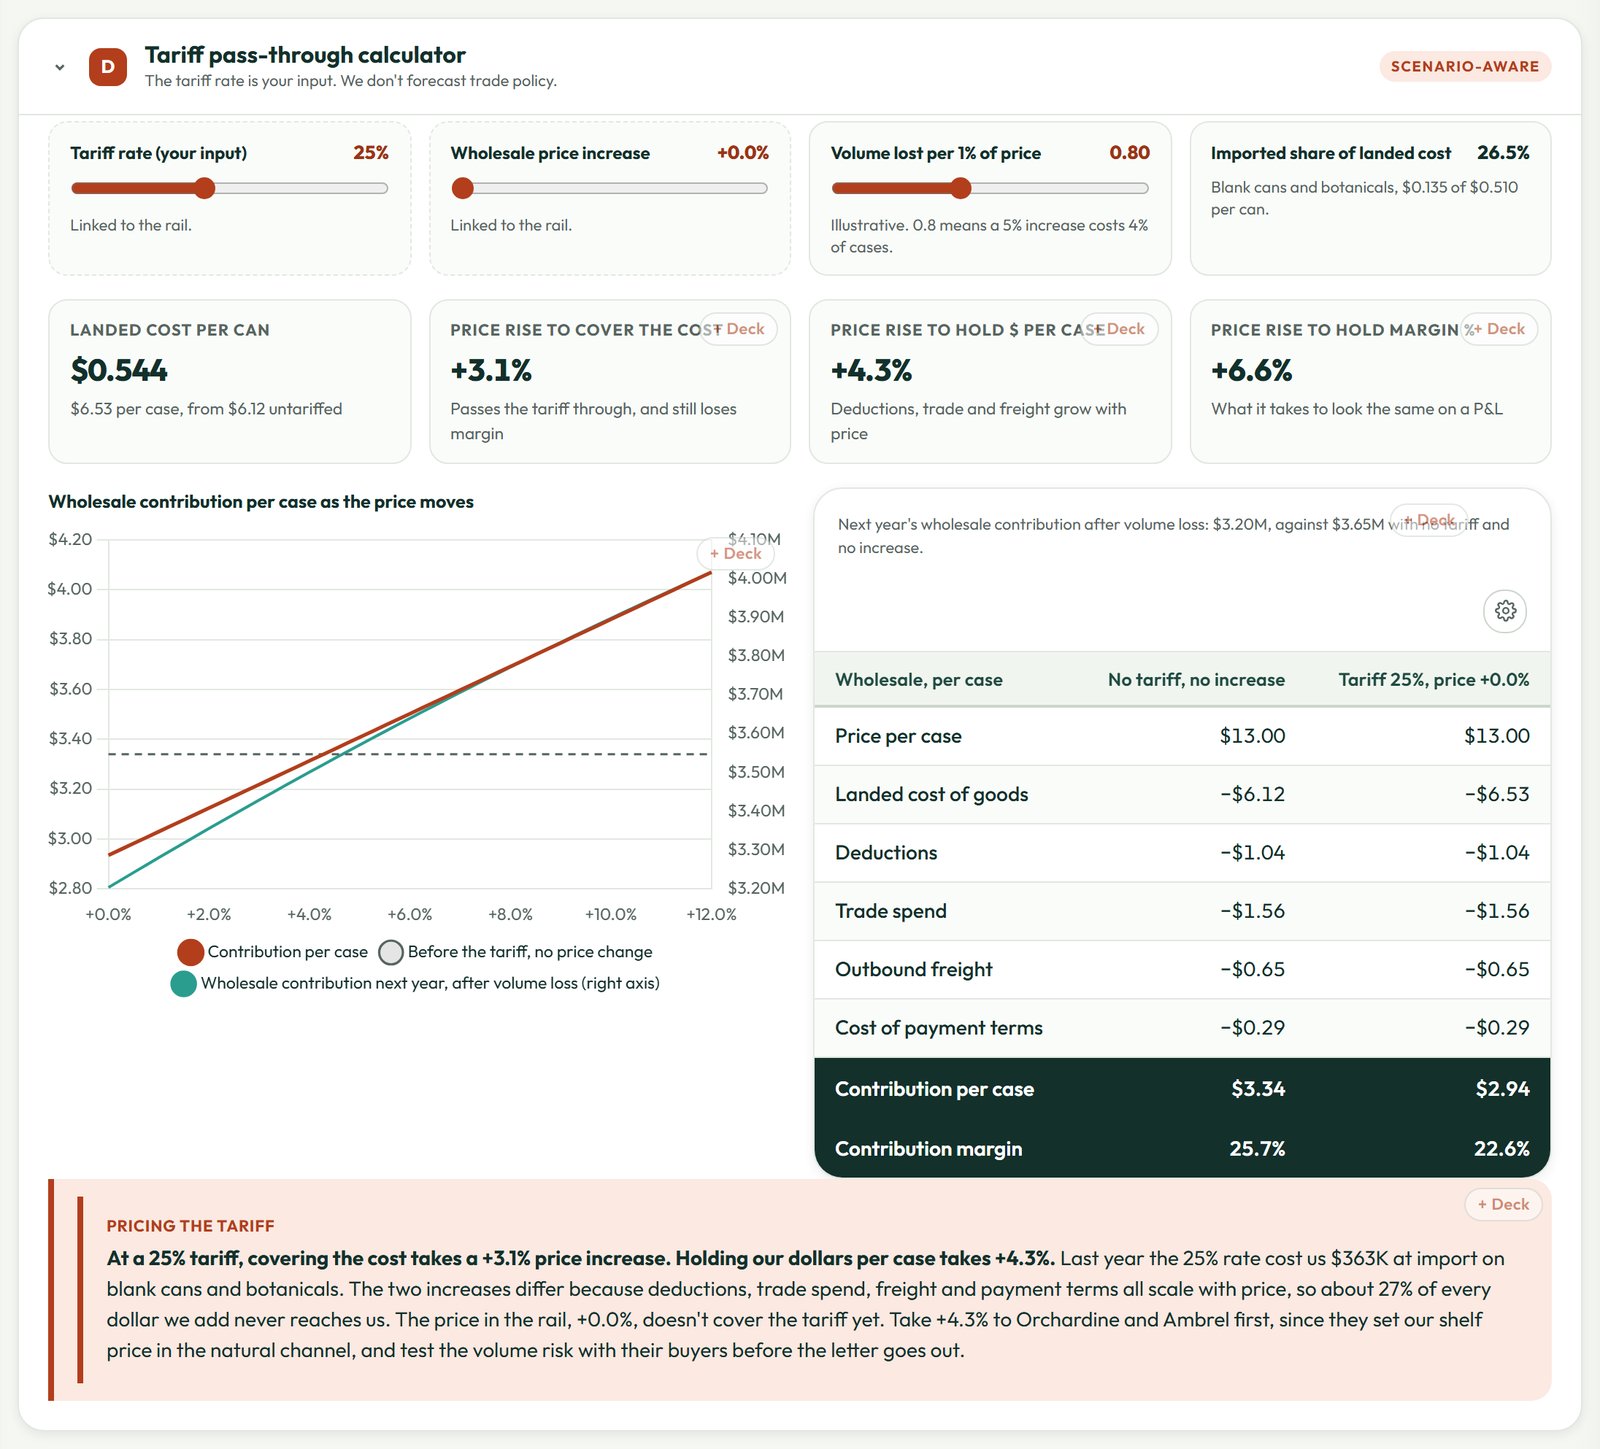
At a 25% tariff input, covering the cost takes a 3.1% wholesale price increase. Holding dollars per case takes 4.3%, because deductions, trade spend, freight and payment terms all scale with price, and about 27% of every dollar added never reaches Wrenfield. Last year the tariff cost $363K at import. I'd take 4.3% to Orchardine and Ambrel first, since they set the shelf price in the natural channel, and test the volume risk with their buyers before the letter goes out.
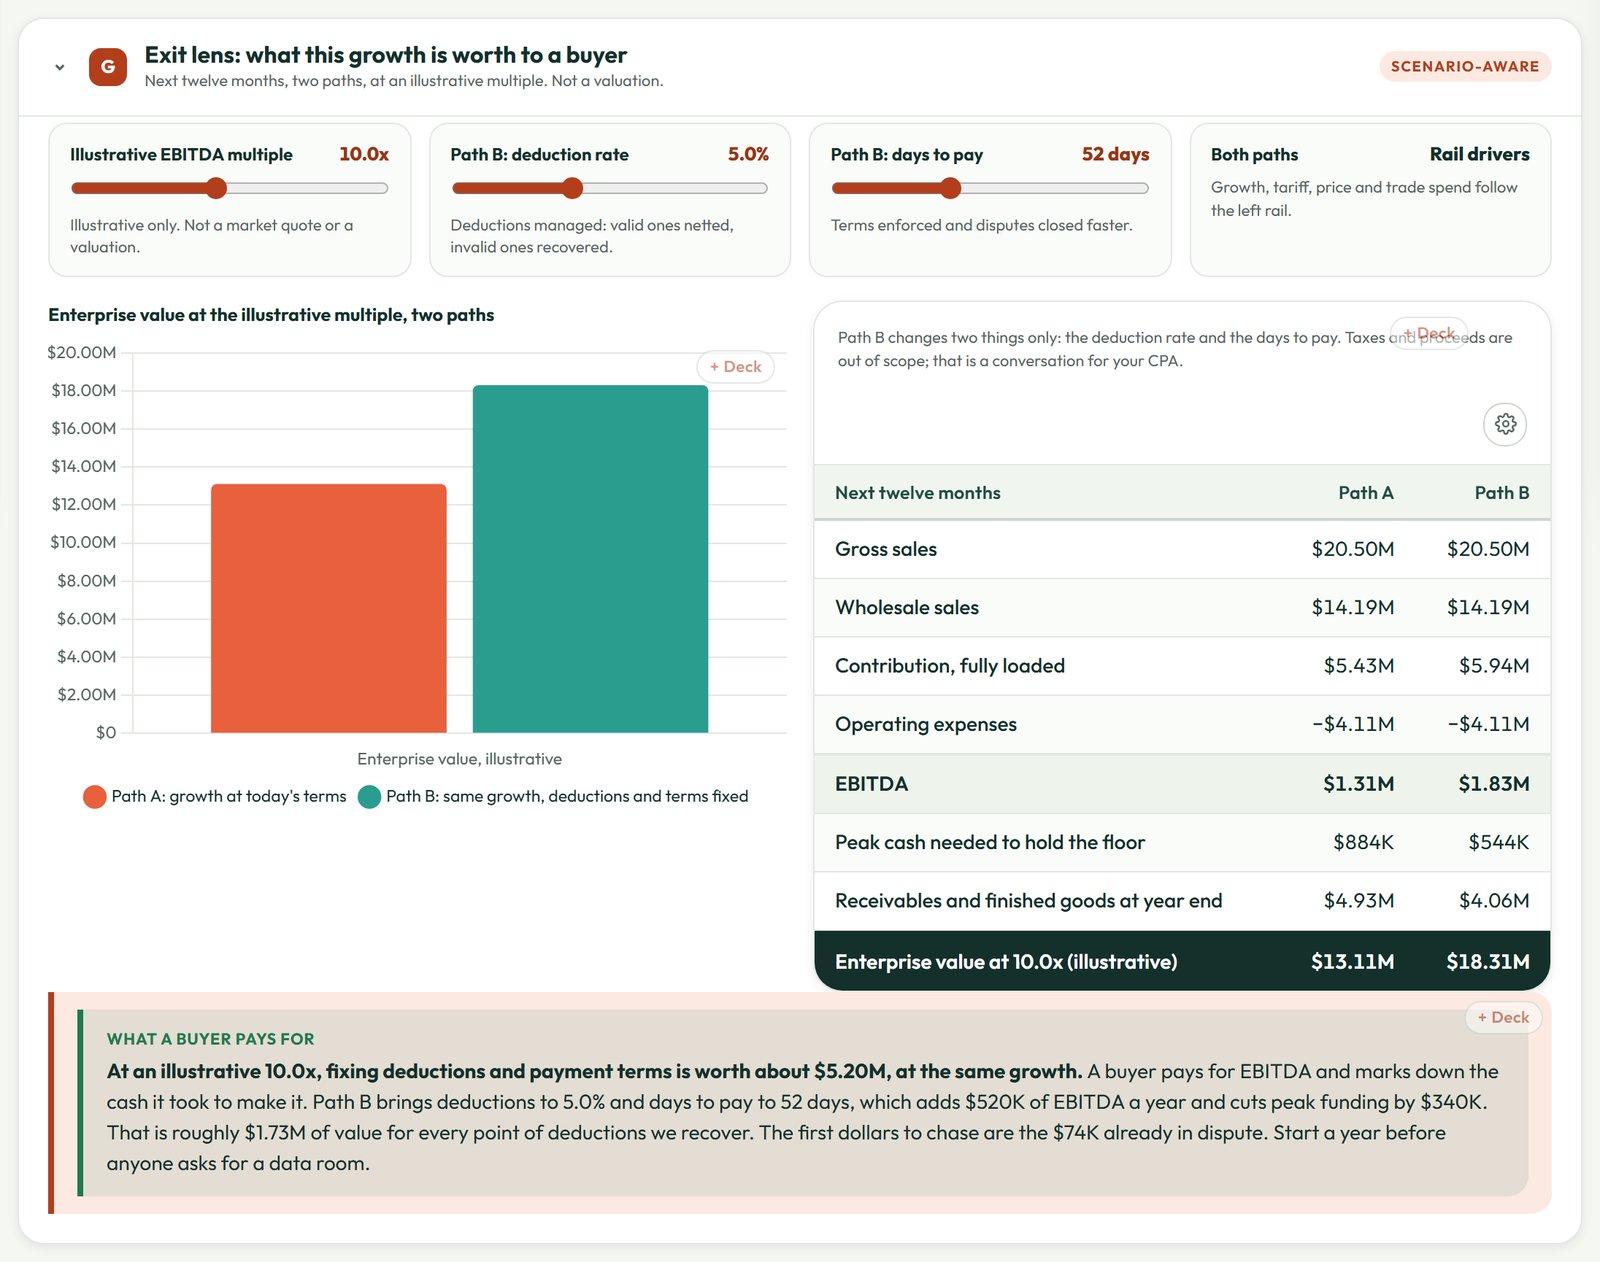
The exit lens runs the same growth two ways. Bring deductions to 5% and days to pay to 52 and EBITDA rises by $520K a year, worth about $5.20M at an illustrative 10x, with $340K less peak funding. That's roughly $1.73M of value for every point of deductions recovered, and the first dollars to chase are the $74K already in dispute.
Scenarios and the lender pack
The drivers on the left of the page move growth, payment terms, deductions, trade spend, the tariff input, price and the financing. Every forward number recalculates, and the four booked weeks never move. Every card, chart and table also has a + Deck button, and the lender pack preset drops the 13-week forecast, the borrowing base and the channel margin into an editable PowerPoint, with the scenario recorded in the speaker notes. The canned beverage scenario model runs the next question on the same forecast: printed cans save Wrenfield about $438K in the first year, and ordering them in August instead of May leaves the line $431K of room in July instead of $283K.
Why not just do this yourself with AI?
You can do a lot of it yourself, and you should use AI. We use it every day. The analysis was never the hard part. Every finding above came from four things a chatbot doesn't have:
- Transaction-level data, kept current. Remittances, deduction backup, invoices, the aging and the bank, pulled after every close and reconciled so the numbers tie to the books.
- Context nobody wrote down. That a distributor changed payables systems, that a promo was agreed at a lower rate, that a slotting fee was a one-time payment for a new chain. We add that to the data so it shows up next to the number it explains.
- Somewhere safe to keep it. Read-only connections, a secured warehouse and access controls, instead of distributor statements and bank exports pasted into a chat window.
- Someone accountable for it. A CFO who knows the business well enough to say that Duncarrow isn't a credit problem, and to make the call that the line gets signed before the next distributor does.
Put those in place and the AI gets a lot more useful too, because it's finally reading the right data.
What it takes to get this on your own numbers
We connect read-only to your accounting system, your ecommerce platform, your marketplace seller account and your distributor portals, and rebuild 24 months of history on one contribution basis by channel, with every deduction coded and every receivable aged by customer. From then on the 13-week cash flow and the borrowing base refresh after every close. That's the center of CFOptimize – accelerate your growth: a lender-ready package built on numbers your banker can underwrite.
If your P&L and your bank balance are telling two different stories, book a time with me, or browse the other demos in our showcase.
Mark.
Wrenfield Sparkling Co. and every distributor, retailer, co-packer and supplier named in this post are fictional, and every figure is invented for illustration. Nothing here is drawn from any client's books. Multiples, rates and the tariff input are illustrative and are not market quotes or forecasts.
Share