Owners of $5 to 25M companies planning a sale or recap in the next 12 to 24 months, and the advisors who will run that process.
What a buyer will actually pay, how much of it reaches the owner at close, and what an 18-month plan is worth.
Almost every owner I sit down with a year or two before a sale asks the same question first, which is what a buyer will pay, and the honest answer starts somewhere they don't expect: with the add-back list they wrote themselves. That list is usually where the gap between the number in the owner's head and the number in the buyer's model begins.
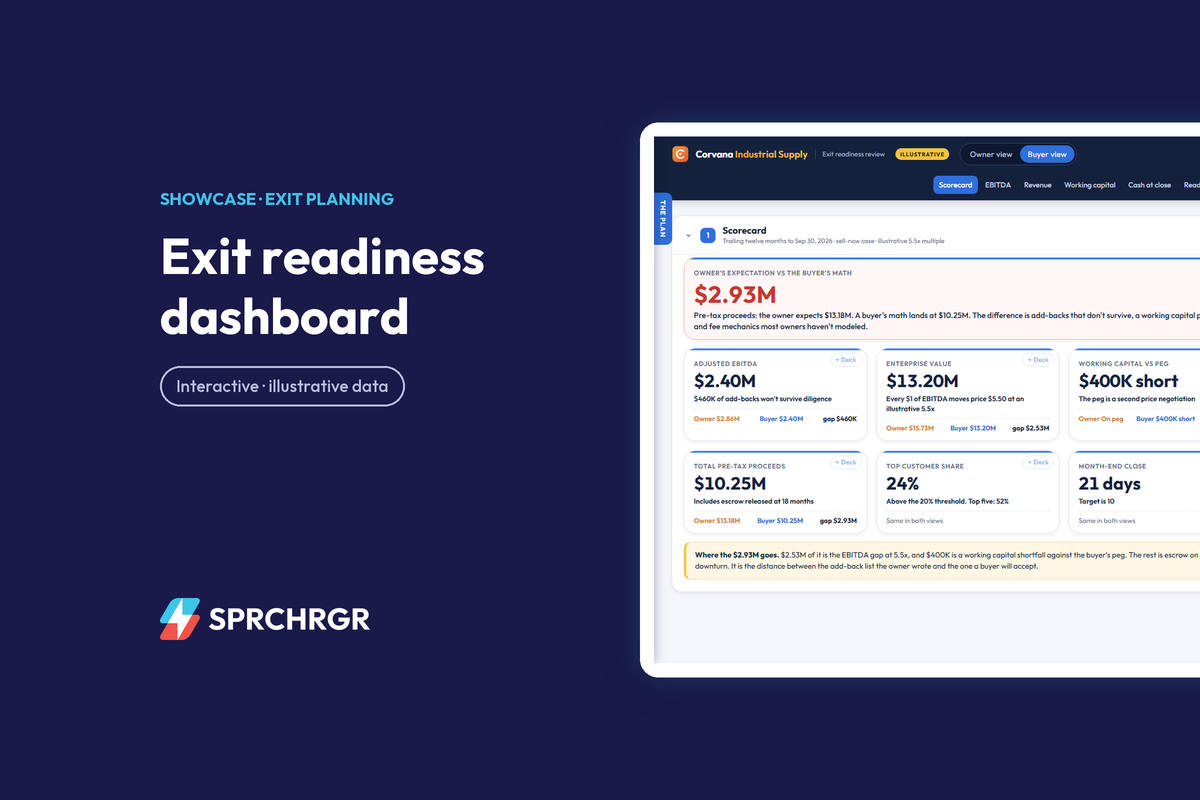
So here's how I'd walk an owner through it, using a working sample dashboard we built for a fictional industrial distributor called Corvana Industrial Supply. Every figure in it is invented, but the shape is real: 22 years old, founder-owned, two warehouses, 64 employees, $18.4M of revenue, and a founder who wants to sell in about 18 months. A switch at the top flips every section between the owner's view and a buyer's, and that switch is most of the conversation.
Start with the three EBITDA numbers
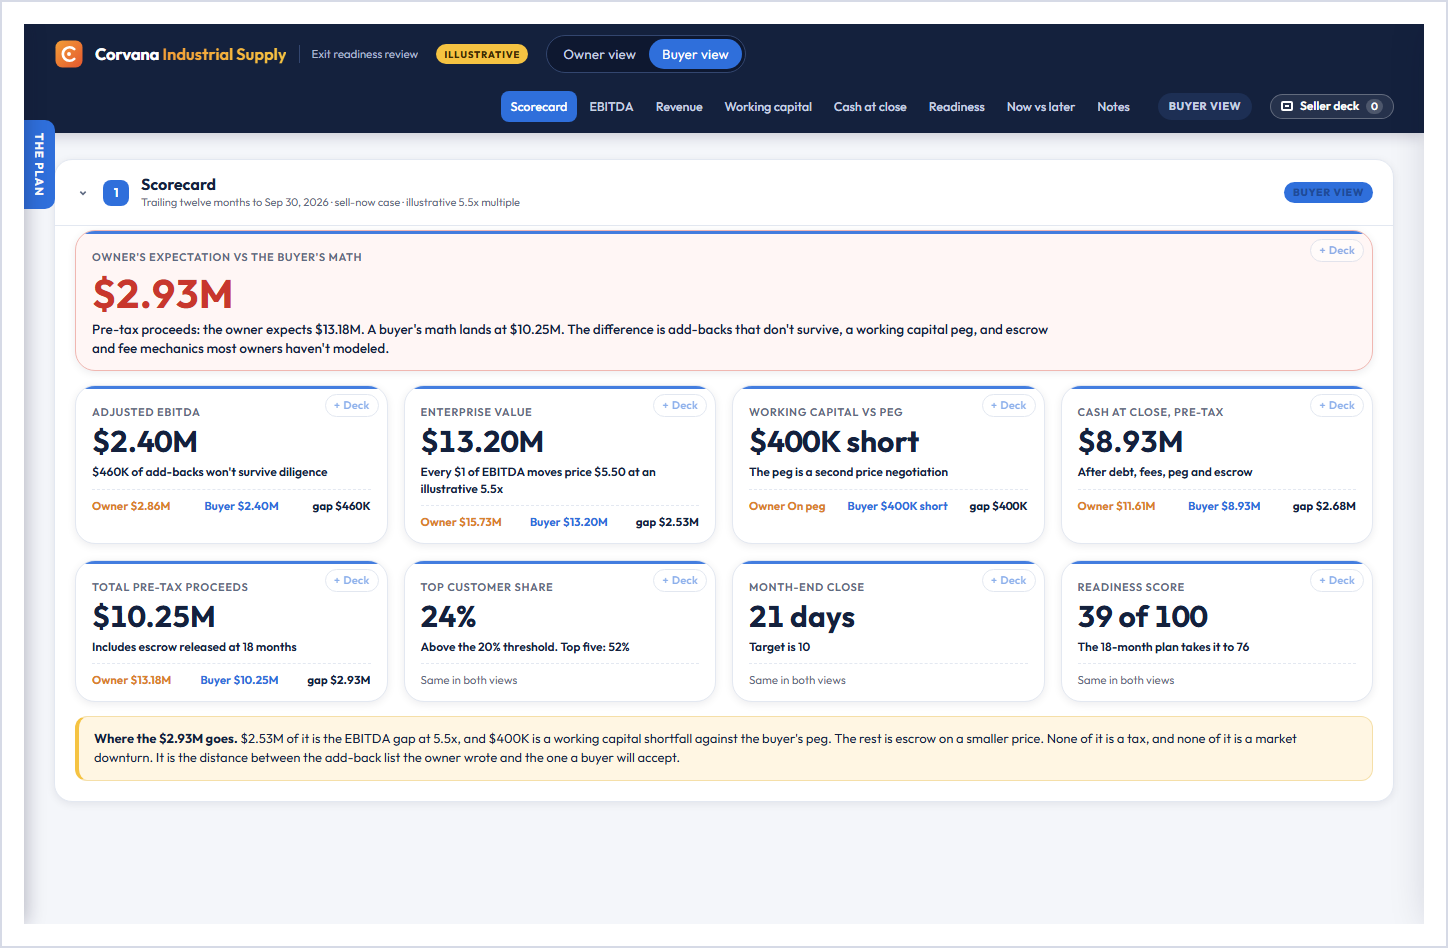
Corvana has three EBITDA numbers, and most owners only know two of them. Reported EBITDA is $2.10M, 11.4% of revenue, the number the books show. Seller-adjusted EBITDA is $2.86M once the founder's add-backs go on top. Diligence-adjusted EBITDA, the number a buyer's quality of earnings team will actually accept, is $2.40M.
The $460K between the last two is the whole story in miniature. At an illustrative 5.5x multiple it's $2.53M of headline value, and by the time it works down through debt, fees, working capital and escrow, the owner expects $13.18M of pre-tax proceeds while the buyer's math lands at $10.25M. That $2.93M is the red card at the top of the page.
My read: nobody is being unreasonable here. The owner wrote the list in good faith, and the buyer is doing the job they're paid to do – the gap is just what happens when nobody has priced the list the way a buyer will.
Show which add-backs survive
The add-back register rates every adjustment as Supported, Supportable or Unsupported, and it puts the buyer's own adjustments right next to the seller's. Owner pay above market, a one-time legal settlement, ERP consulting and related-party rent are all documented, so all four survive at full value. Personal expenses run through the business drop from $95K to $55K because only part of it has receipts. The pro forma price increase goes from $120K to zero, because it's only been in effect for two months.
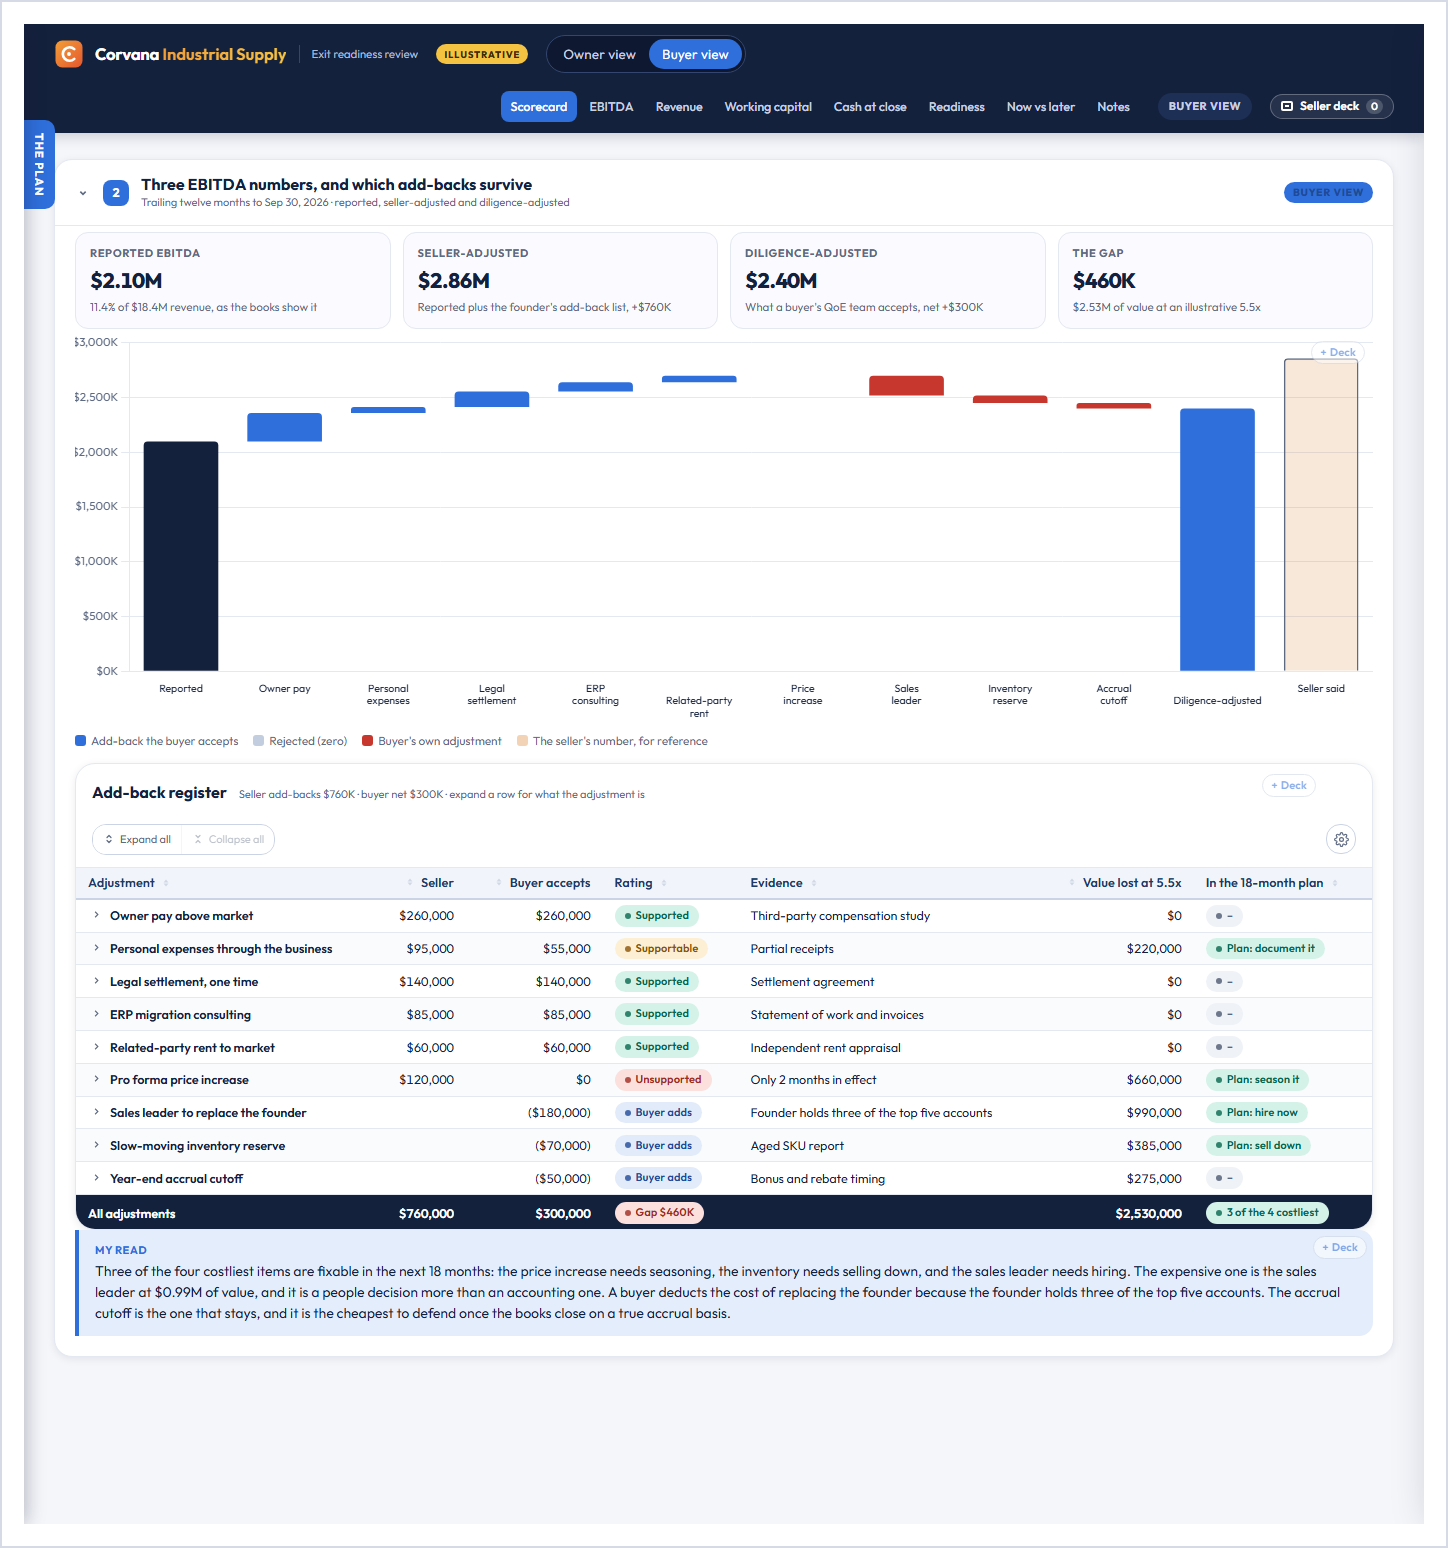
Then the buyer adds three of their own: $180K for a sales leader to replace the founder, $70K for a slow-moving inventory reserve and $50K for a year-end accrual cutoff.
My read: the sales leader is the expensive one, at $990K of value, and it's a people decision more than an accounting one. The founder personally holds three of the top five accounts and 38% of revenue, and a buyer will price that risk twice – once in EBITDA, and again in the earnout.
Have the peg conversation before the LOI
This is the $400K most owners discover in week six of diligence. A deal assumes a normal level of working capital is delivered at close, called the peg, and any shortfall comes off the price dollar for dollar. Corvana's buyer proposes a peg of $4.75M on a seasonally adjusted basis, and Corvana is on track to deliver $4.35M at a March close, because the owner plans to work down inventory and collect hard into the sale.
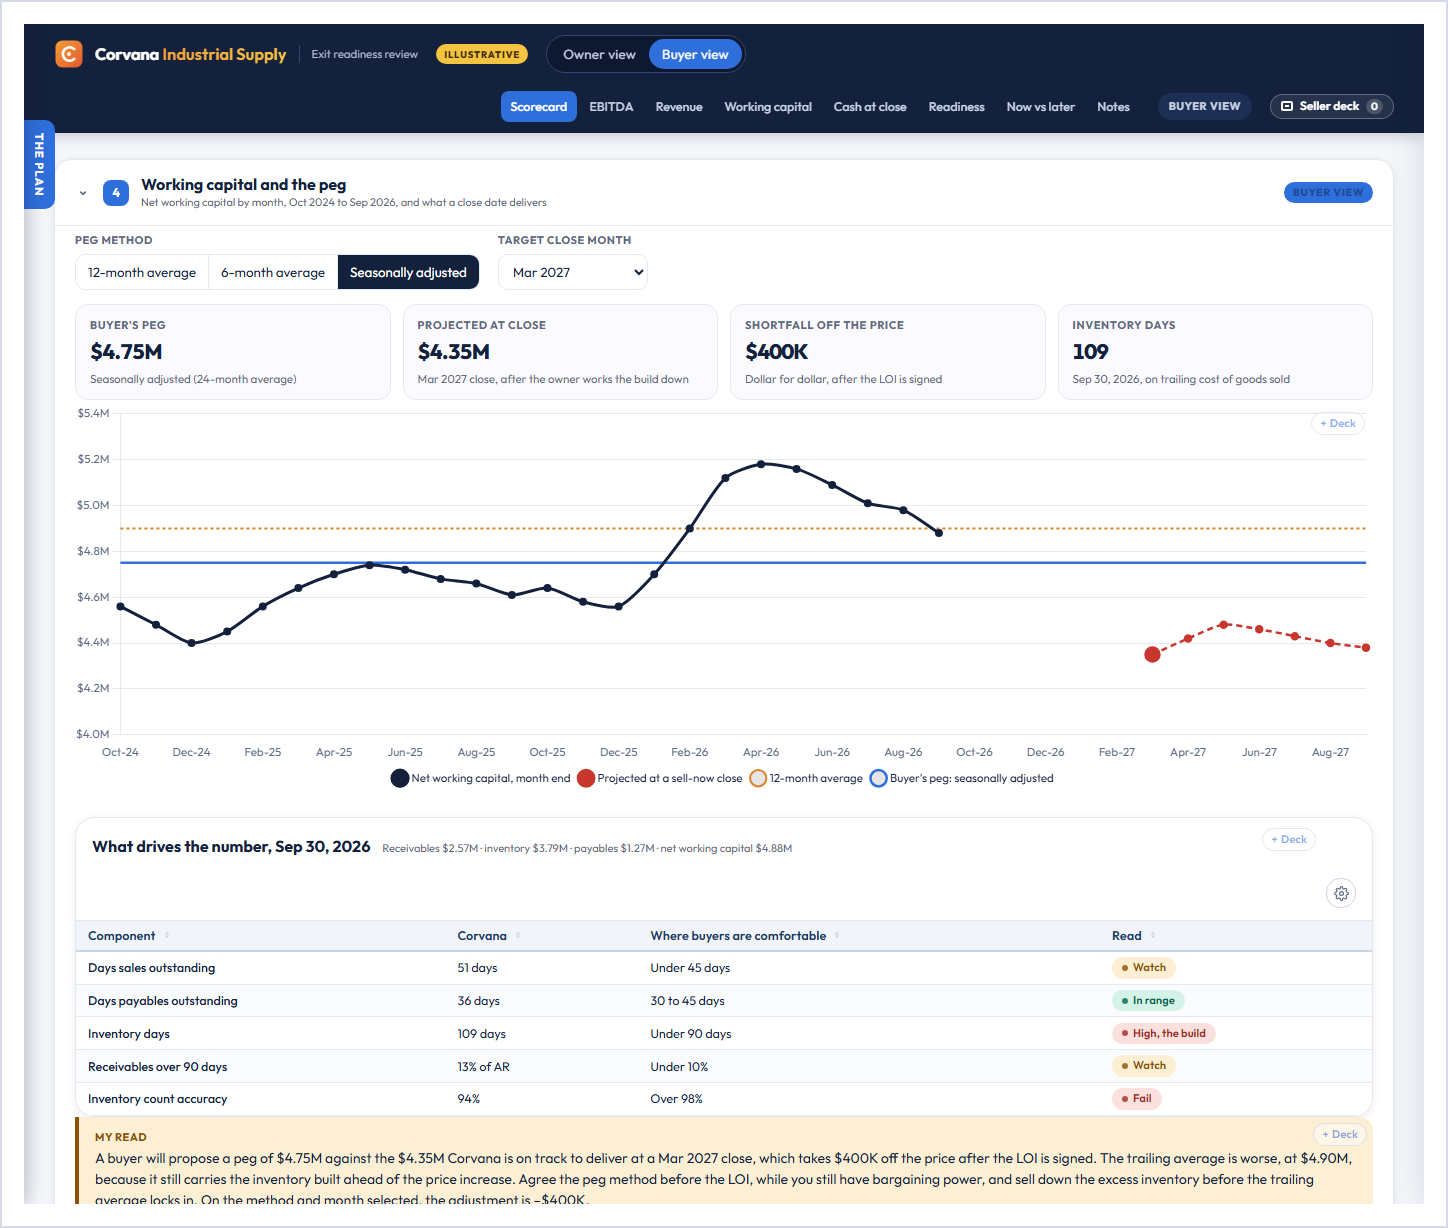
The dashboard lets you toggle the peg method and move the close month. The trailing twelve-month average is worse for the seller, at $4.90M, because it still carries inventory built ahead of the price increase. Moving the close into the busier months narrows the gap without closing it.
My read: agree the method in the LOI, while you still have bargaining power, and sell down the excess inventory well before the trailing average locks in. After the LOI, the peg is a second price negotiation you're having from a weaker seat.
Walk down from enterprise value to cash at close
In buyer view, a $13.20M headline becomes $8.93M of cash at close. Net debt takes $1.80M, the peg shortfall $0.40M, banker, legal and QoE fees $0.75M, and a 10% escrow holds back $1.32M. The escrow comes back at 18 months if nothing goes wrong, which brings total pre-tax proceeds to $10.25M.
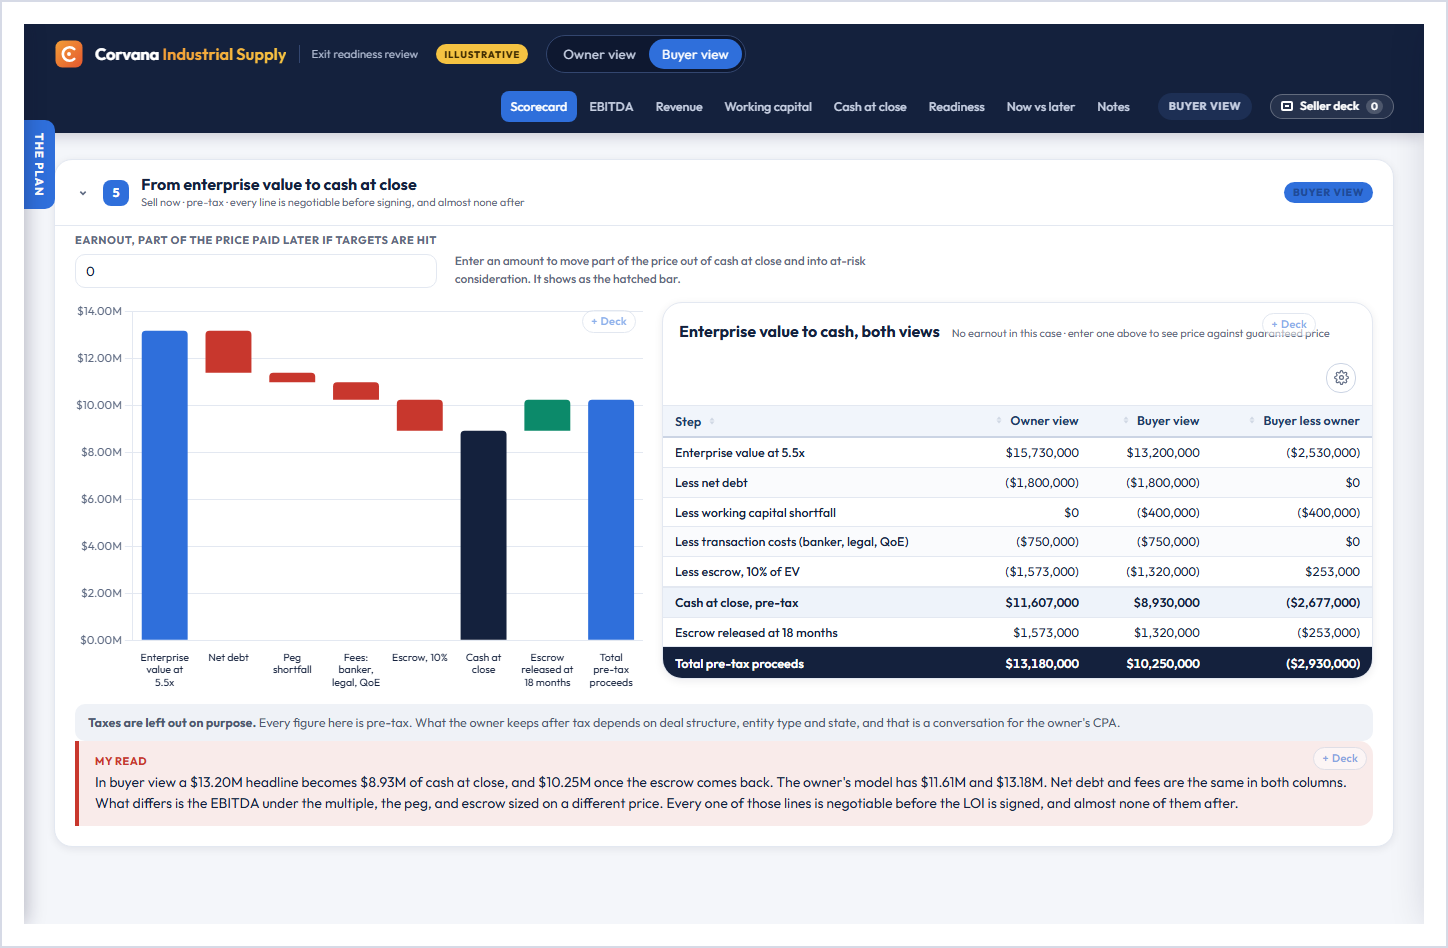
Type a number into the earnout input and part of the price moves out of cash at close into money you collect only if targets are hit, which is the difference between price and guaranteed price. Taxes are left out on purpose. After-tax proceeds depend on structure, entity type and state, and that's a conversation for your CPA.
My read: every one of those lines is negotiable before signing and almost none after, so the time to model this page is before anyone sends a term sheet.
Run sell-now against sell-later
The levers on the left are an 18-month plan, and each one prices a single fix. Documenting the personal expenses turns Supportable into Supported. Twelve months of history makes the price increase defensible. Hiring the sales leader now moves that cost into reported EBITDA, takes away the buyer's adjustment and cuts founder-held revenue toward 15%. Selling down inventory closes the peg shortfall, and fixing the close, the accrual history and the forecast lowers the risk a buyer is pricing.
With the plan on, buyer-view proceeds go from $10.25M to $12.81M. I'd read that in two halves, and the dashboard shows them separately. $1.28M is earned: $160K more EBITDA a buyer will accept at the same 5.5x, plus a peg you're no longer short on. The other $1.28M comes from moving to an illustrative 6.0x for a lower-risk business, which is a reasonable expectation and not something anyone can promise you. The $12.81M also assumes net debt stays at $1.8M, fees don't change and the escrow comes back in full.
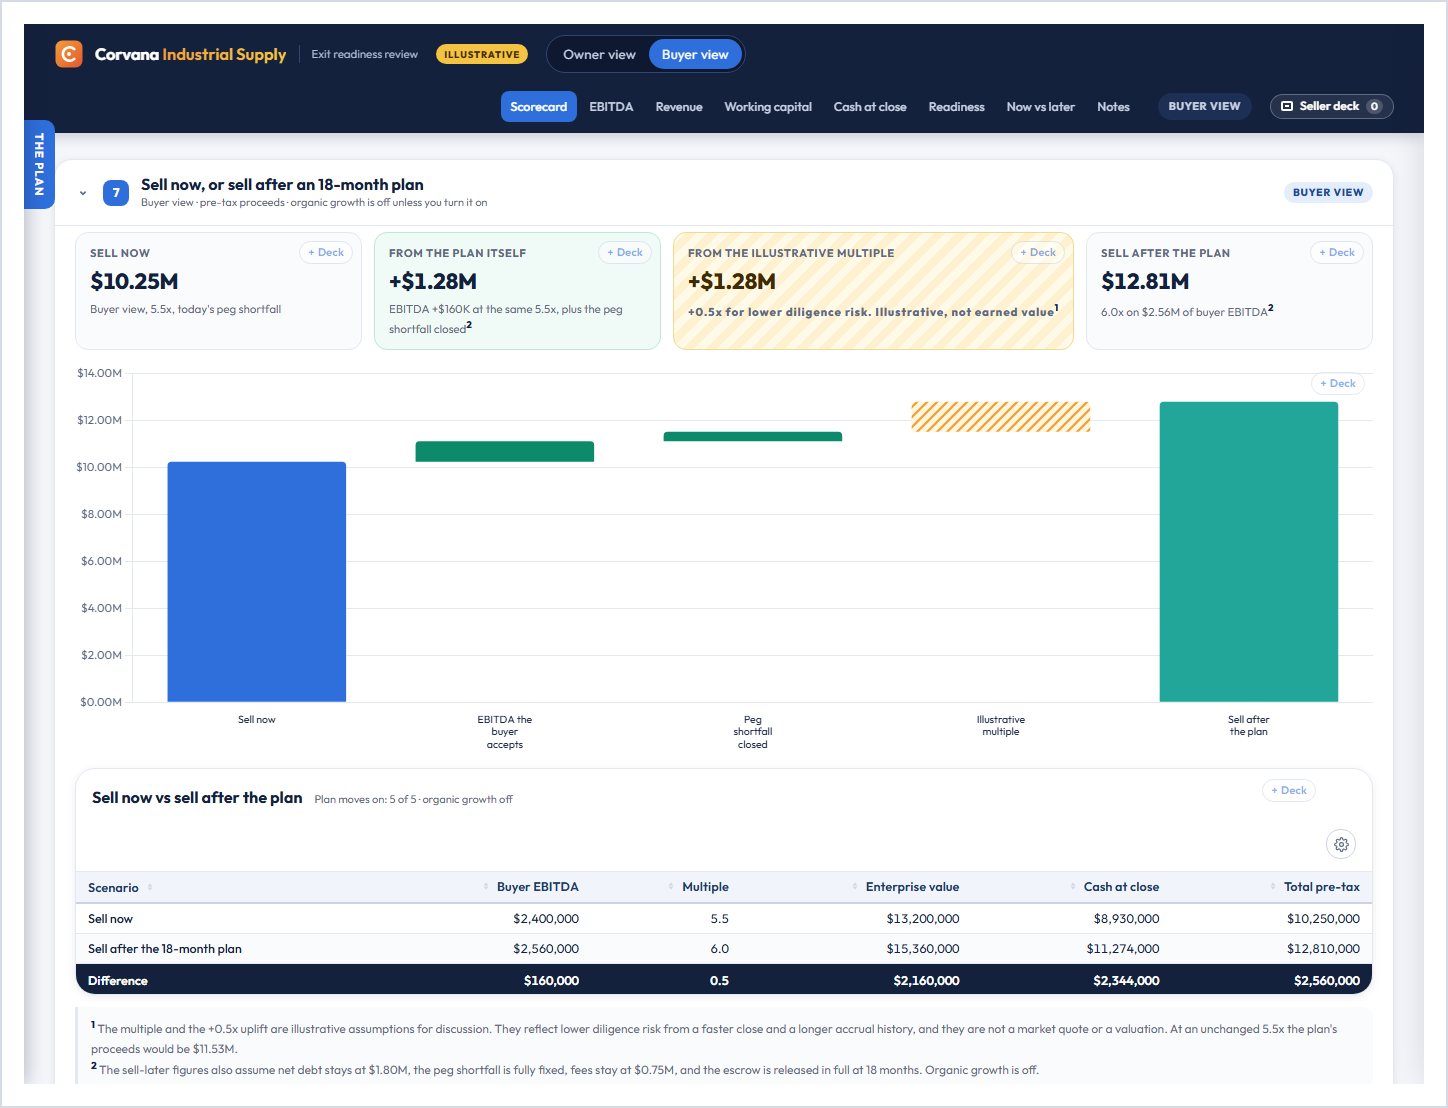
Organic growth stays off by default, so the plan's value is never confused with growth, and the readiness score moves from 39 to 76 alongside it.
My read: the earned half alone pays for the preparation many times over, and the multiple is upside you position for rather than count on.
Build the seller prep deck
Every card, chart and table on the page has a + Deck button. If you don't want to pick, Use the seller prep pack loads the set an owner usually brings to a banker or attorney: the scorecard, the EBITDA bridge, the add-back register, concentration, the peg, the walk to cash, the readiness tests and sell-now against sell-later, ending on a next-steps slide. It downloads as an editable PowerPoint, and the speaker notes record which view and plan moves were active.
My read: walking into the first advisor meeting with this already built changes the tone of that meeting, because you're asking how to close specific gaps instead of asking what your business is worth.
What it takes to get this on your own numbers
We connect read-only to your accounting system, rebuild 36 months on an accrual basis (Corvana only has 20, which is its own readiness gap), and put every add-back in one register with the evidence attached. Then we price each gap the way a buyer will, and rank the fixes by dollars at stake and months to close.
That's CFOptimize Exit Readiness, and it ends with a ranked plan and a timeline you can take to your banker or attorney. If you'd like to see it on your own numbers, grab time with me and we'll walk through them together.
For the thinking behind each section, see our 3-pillar transaction readiness guide (the thresholds behind the readiness tests), 9 things you should know before due diligence, the 11-step exit framework and 5 common exit deal pitfalls (worth reading before any LOI).
Mark
Corvana Industrial Supply is a fictional company and every figure in the dashboard and in this post is invented for illustration. Nothing here is drawn from any client's books. Multiples are illustrative assumptions, not market quotes, and nothing here is tax, legal or investment advice.
Share