Founders of consumer subscription apps doing $1 to 10M of revenue, and the investors, CPAs and lenders who read their numbers.
Which growth is worth buying, how much of your revenue the app stores keep, and what your subscriber base is worth to an investor or a buyer.
Most subscription founders start Monday with the same screen: paying members, MRR and growth, straight from the billing tool. It's a good screen. It just can't tell you that the campaign you scaled in September is buying members for more than they'll ever pay you, or that the app stores now cost you more than your song licensing and hosting combined.
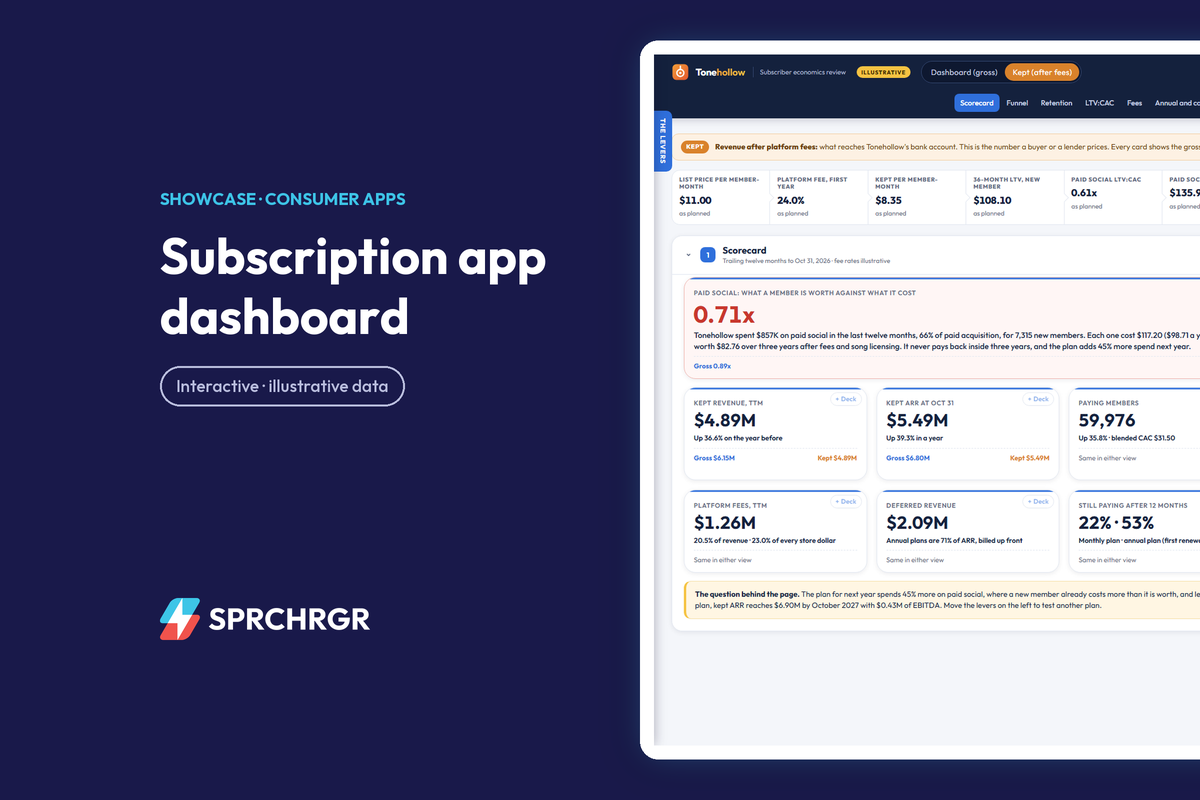
An AI tool can't tell you that either, if all you give it is the P&L. The answers sit in the cohort data, the ad accounts, the creator codes and the store payout reports, matched member by member and month by month. So here's how I'd walk a founder through a quarter using a working sample dashboard we built for a fictional guitar and ukulele lessons app called Tonehollow. The company, its partners, campaigns and numbers are invented. The patterns are ones I see in real subscription books.
The quarter in three sentences
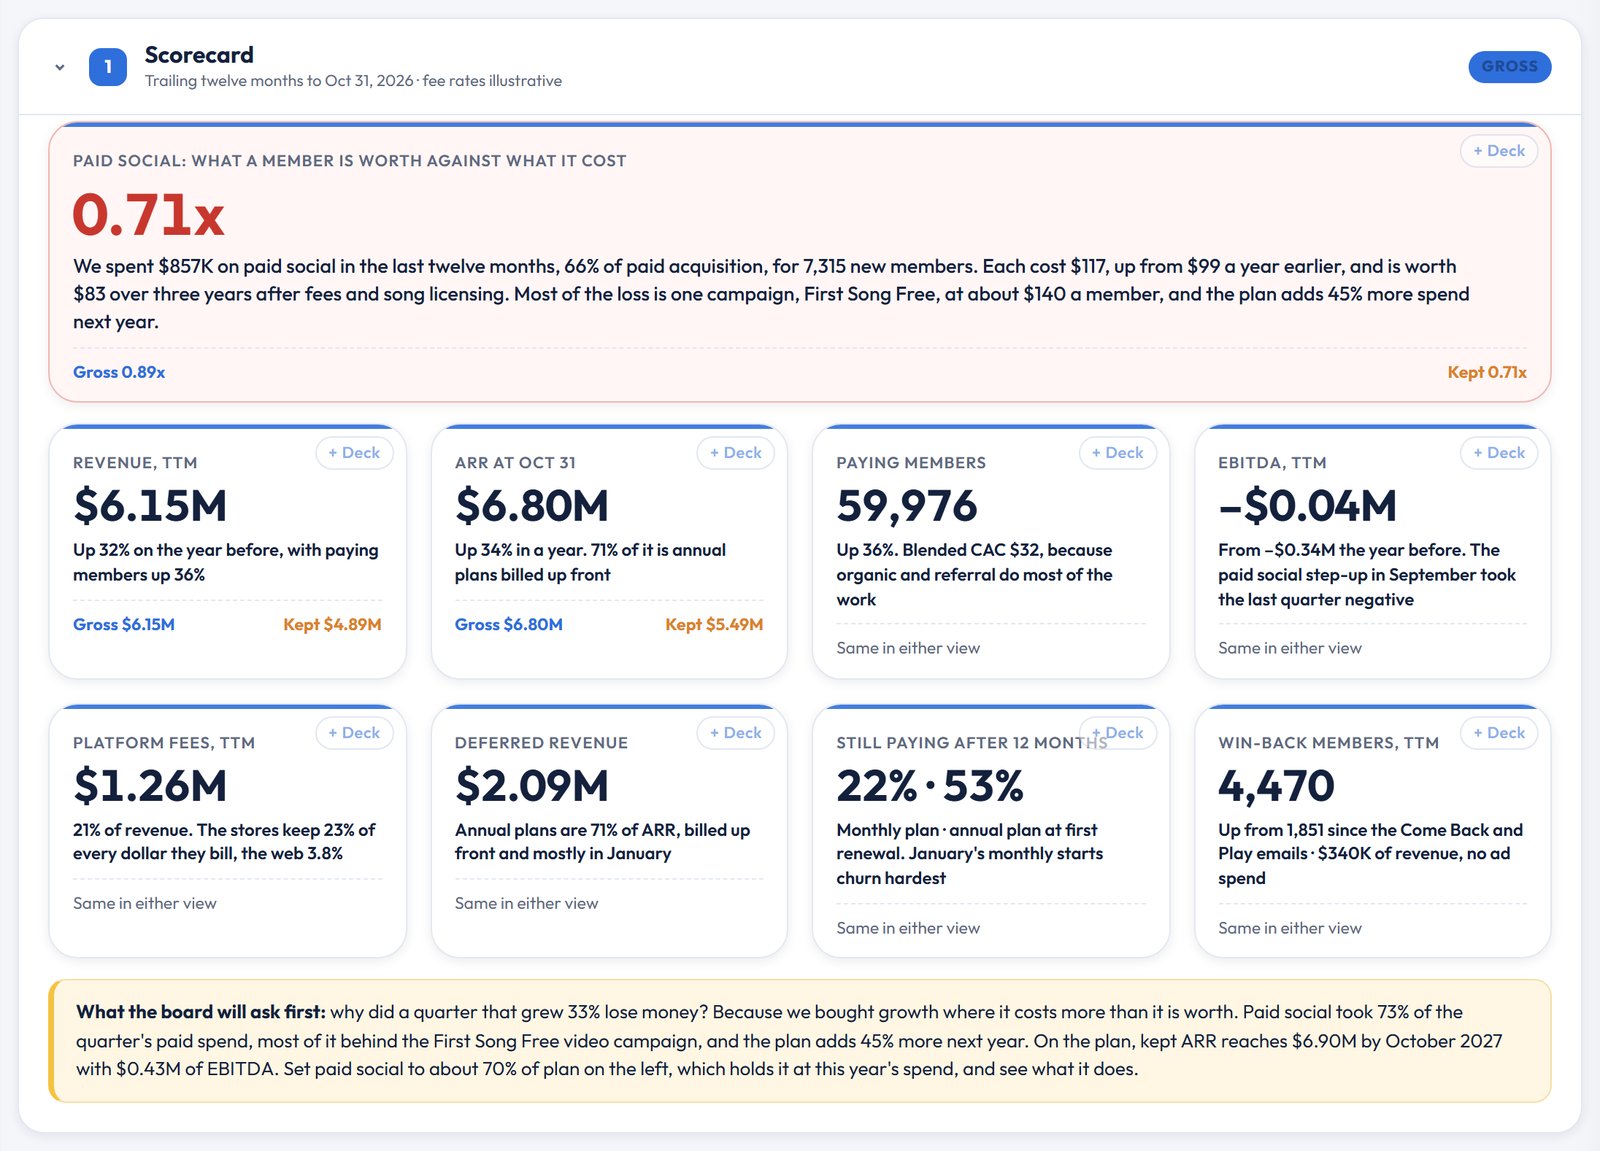
This is the paragraph at the top of the page, written the way I'd want the founder to say it to a board member:
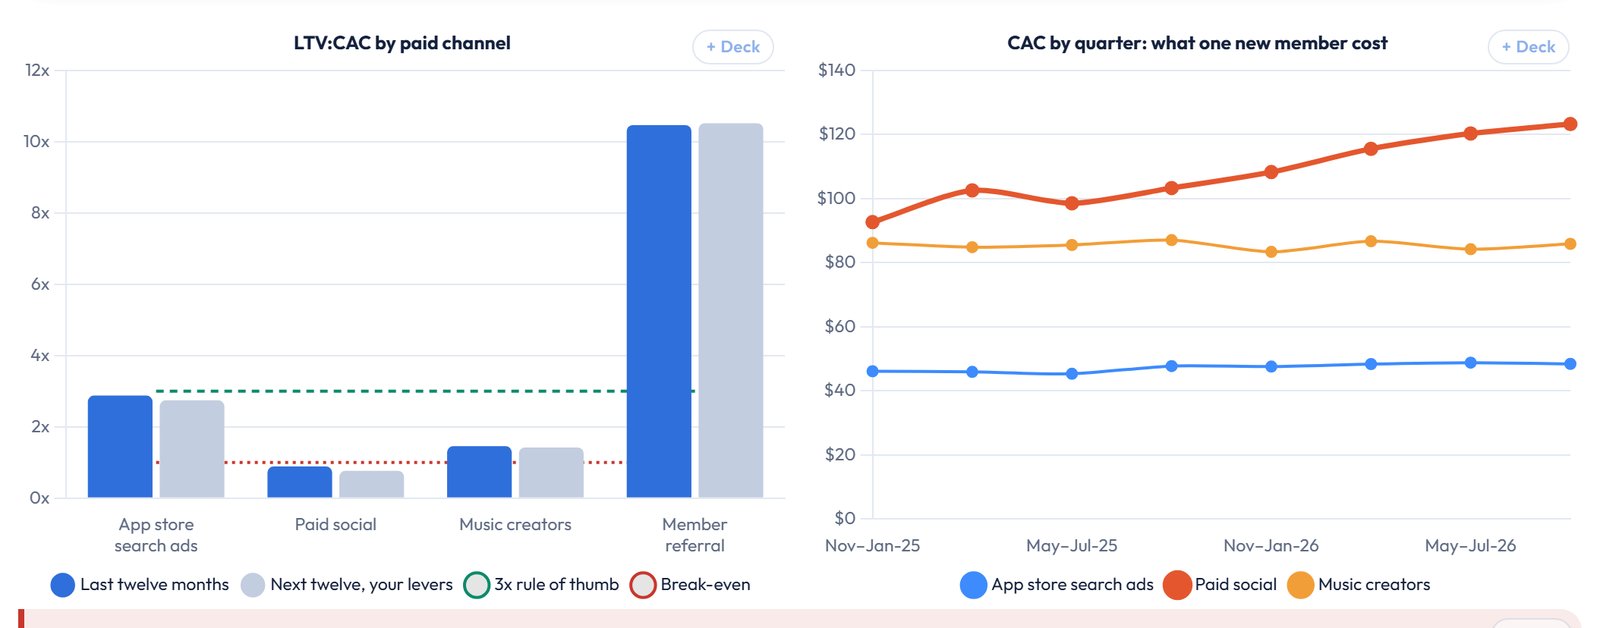
We earned $1.65M from August through October, 33% more than the same quarter last year, and kept $1.33M after the app stores and card processors took their share. We also spent $394K on paid acquisition, 44% more than the quarter before and 73% of it on paid social, which tipped the quarter to a small loss. That's the money we move first: a paid social member costs $117 and is worth $83 to us, while search ads return 2.2x what they cost and member referrals 8.3x.
A summary of the P&L would get the first sentence. The second and third need every member tied to the channel that brought them in and the revenue they actually produced after fees.
Where the growth came from
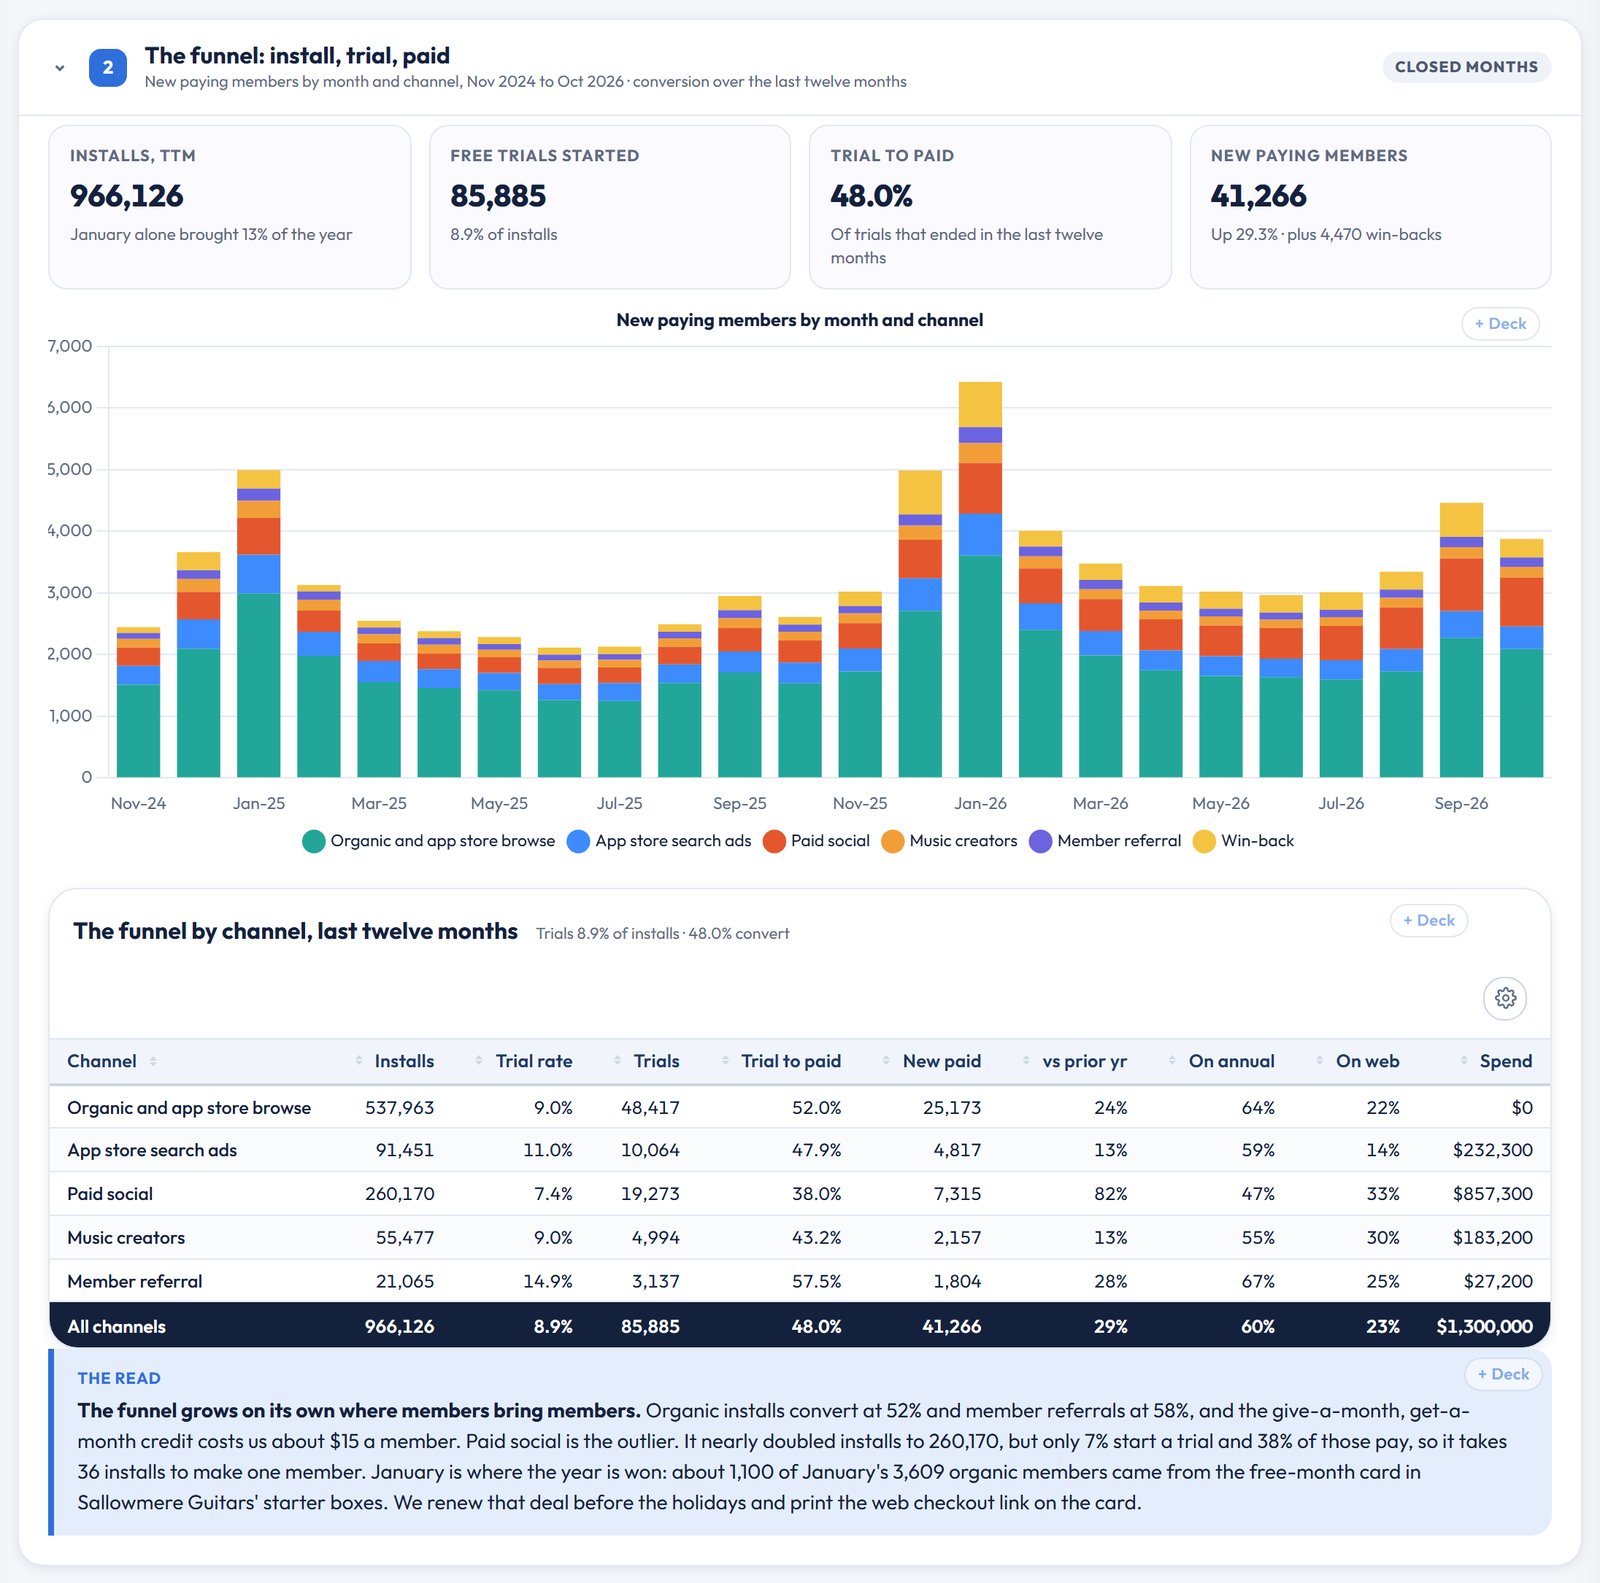
Tonehollow had 966K installs over the year and 41,266 new paying members. The funnel is healthy where members bring members: organic installs convert from trial at 52% and member referrals at 58%, and the give-a-month, get-a-month credit costs about $15 a member.
January is where the year is won. It's the month the holiday guitars come out of the box, and January 2026 was Tonehollow's biggest month ever at 5,691 new members. About 1,100 of January's organic members came from one partner deal: a free-month card in Sallowmere Guitars' starter boxes. That's the kind of thing that never shows up as a line in the P&L, and it's the first deal I'd renew before the holidays, with the web checkout link printed on the card.
Retention by plan, not in total
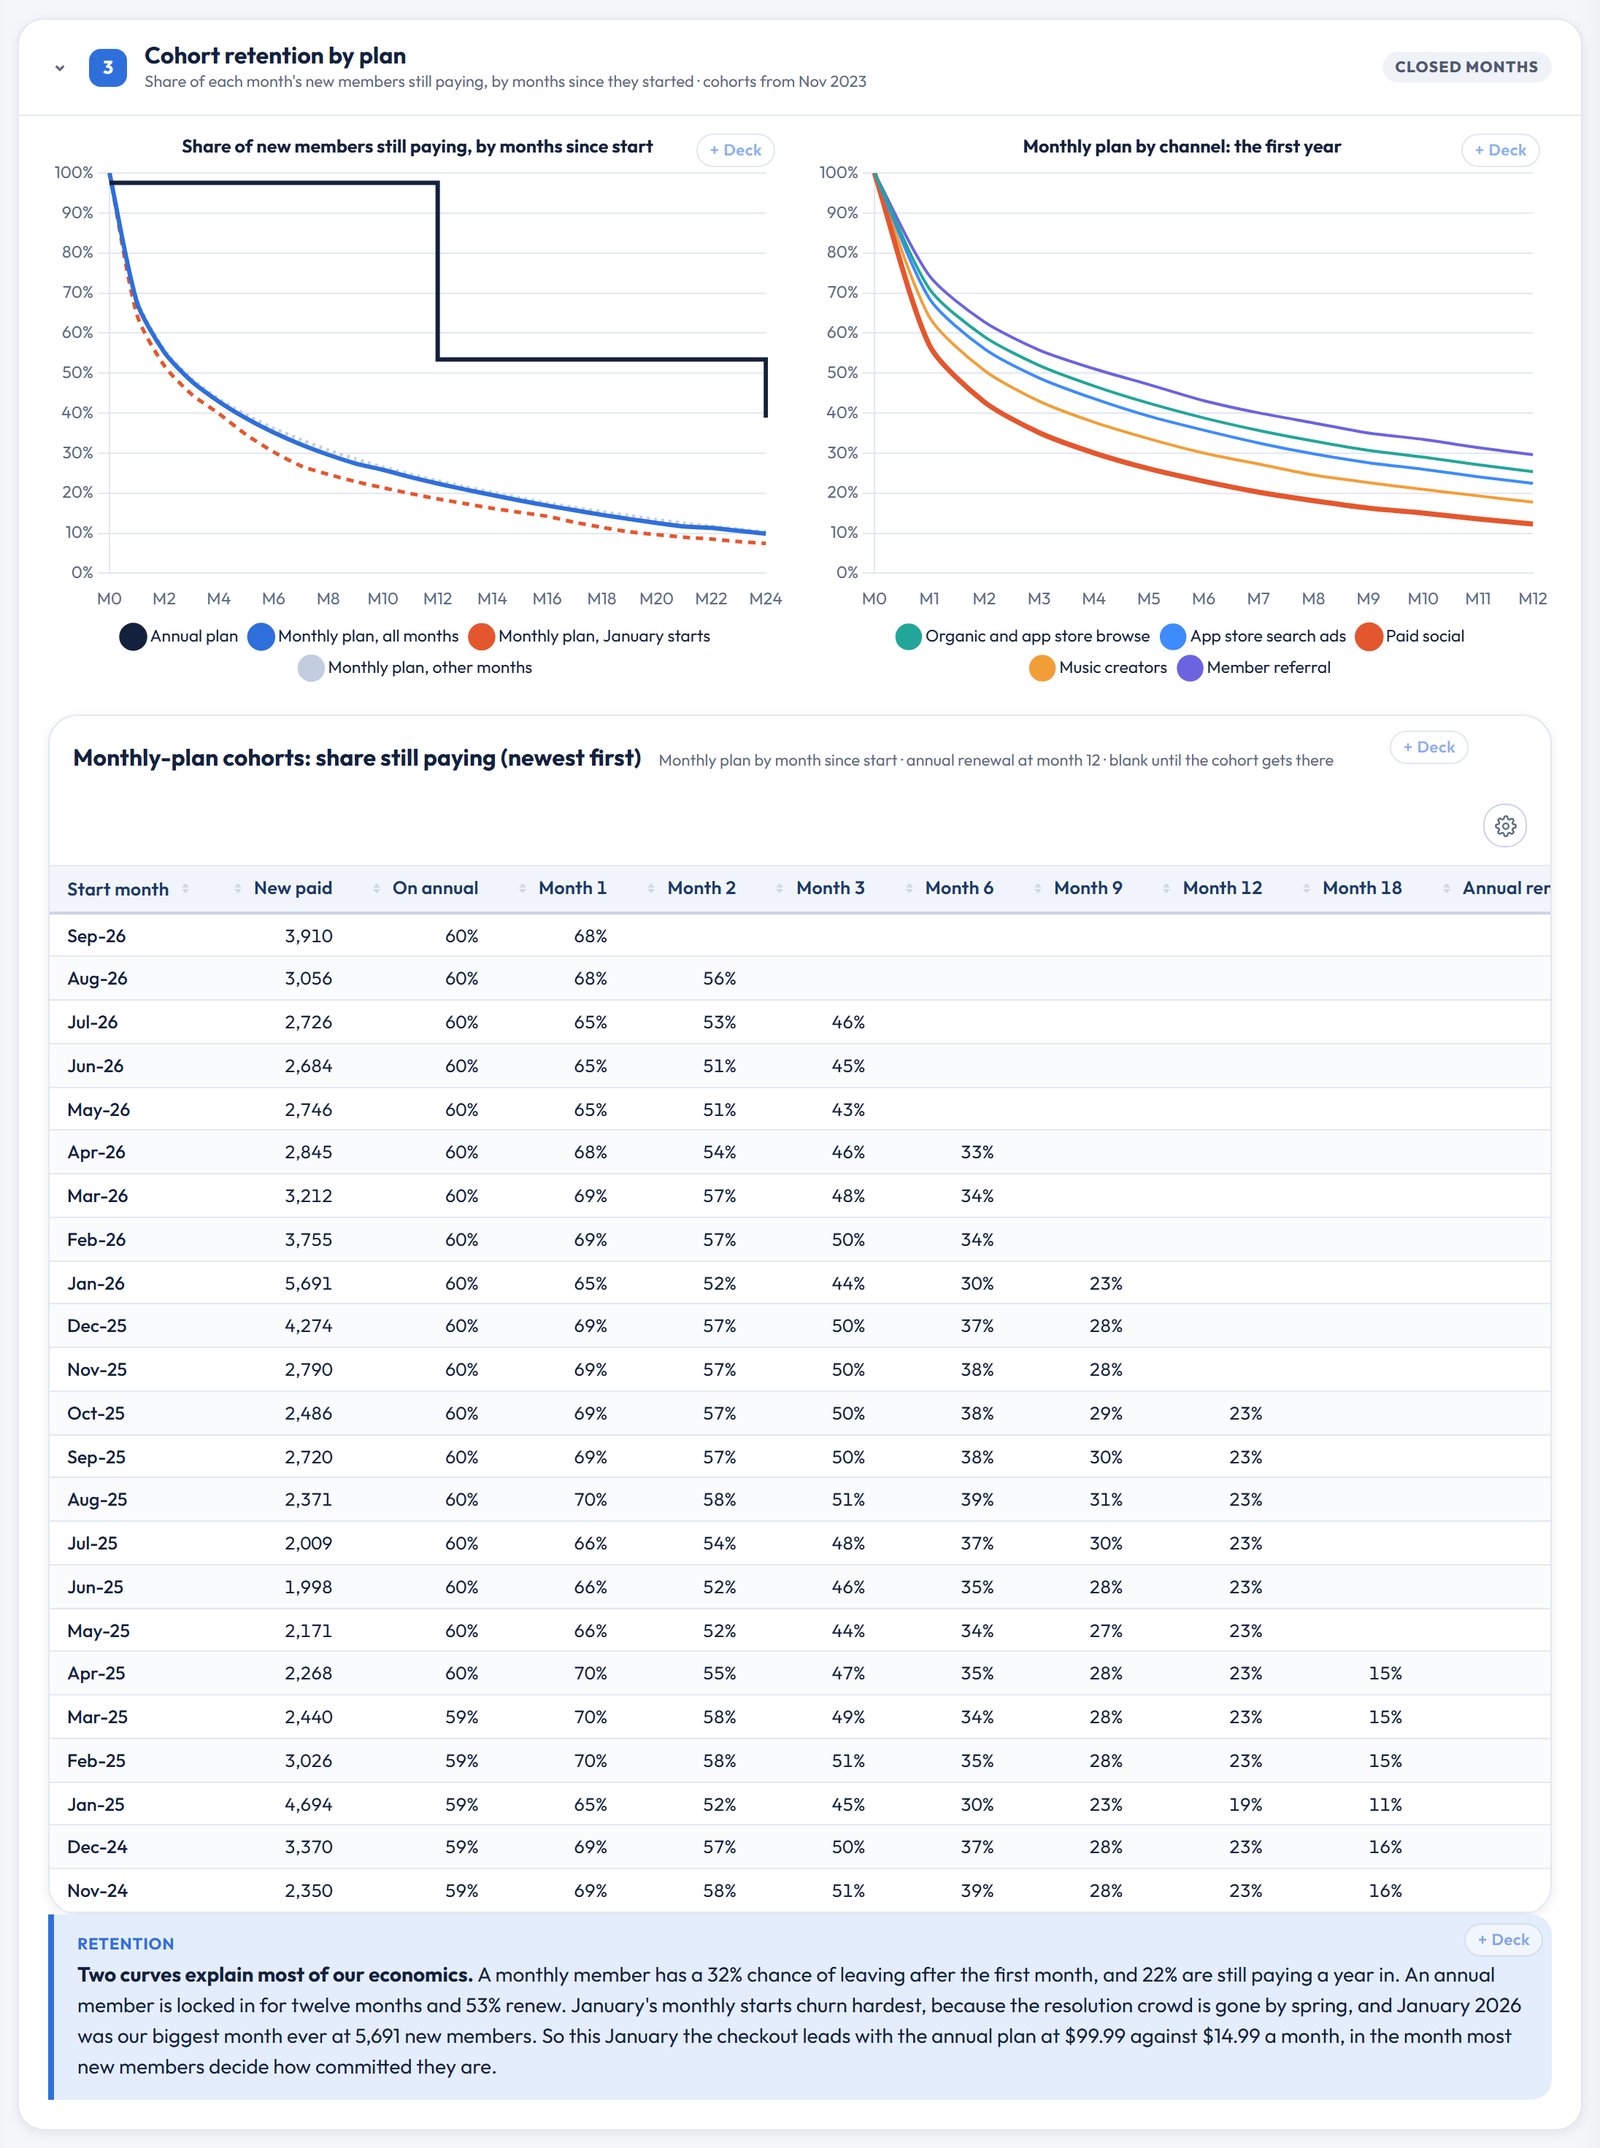
A blended churn number hides almost everything here. A monthly member has a 32% chance of leaving after the first month, and 22% are still paying a year in. An annual member is locked in for twelve months and 53% renew. January's monthly starts churn hardest, because the resolution crowd is gone by spring. So this January the checkout leads with the $99.99 annual plan, in the month most new members decide how committed they are.
The campaigns that moved the year
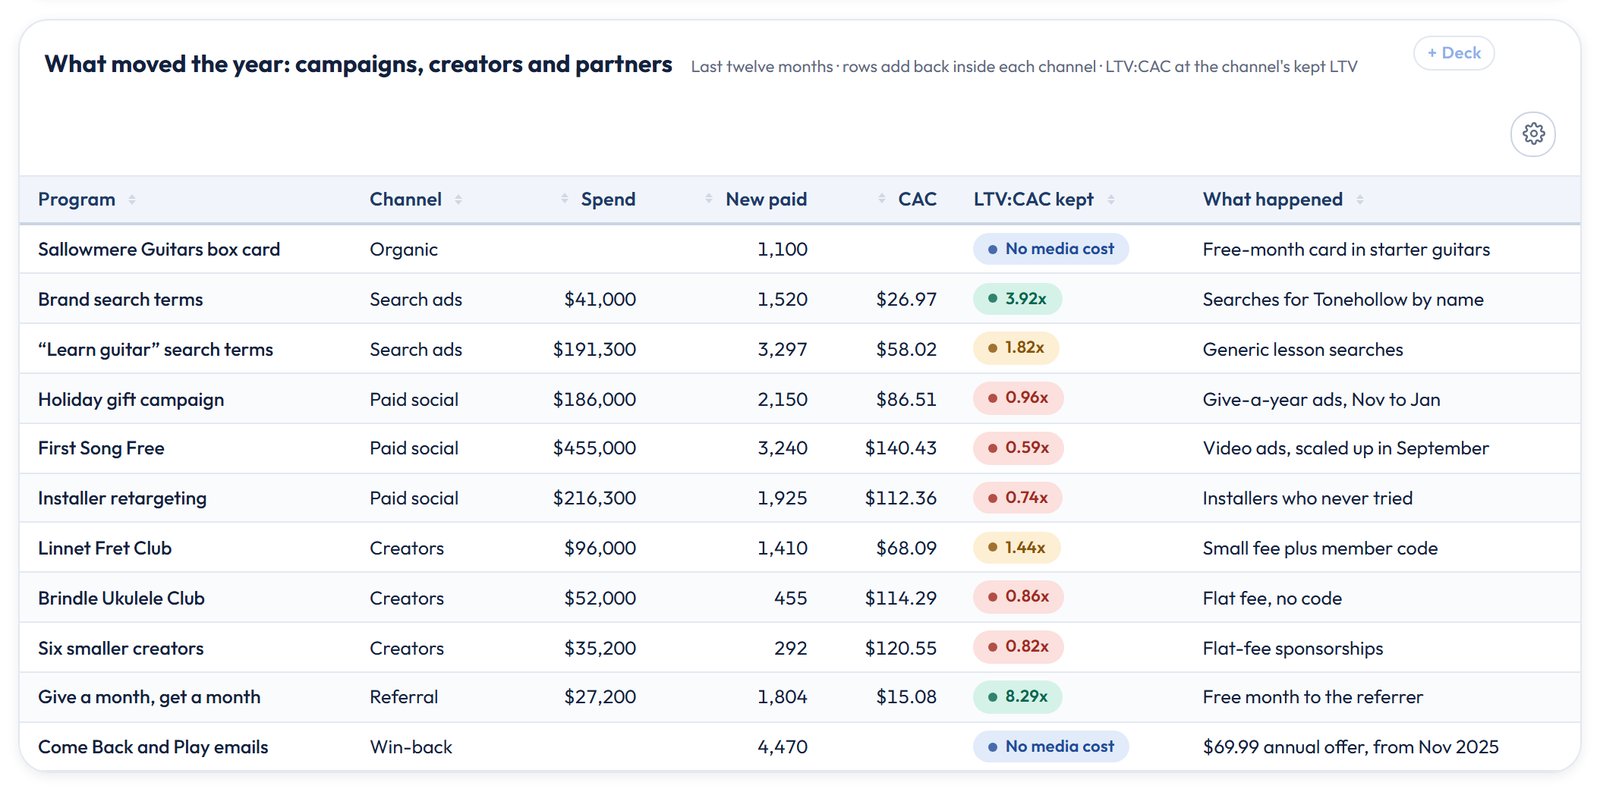
Channel averages are where most subscription reporting stops, and it's where the decisions get blurry. Paid social as a whole returns 0.71x: each member costs $117 and is worth $83 over three years after fees and song licensing. Split it by campaign and the decision makes itself.
- The holiday gift campaign ran November to January and came close to break-even at 0.96x.
- First Song Free, the video campaign scaled up from April and pushed to about $100K a month in September, costs about $140 a member for 0.59x. It's most of the paid social loss, and it's why the last quarter went negative.
- Linnet Fret Club, a guitar creator paid a small fee plus a member code, returns 1.4x. Brindle Ukulele Club and the smaller flat-fee creators don't cover their cost.
- Brand search terms return almost 4x, and generic "learn guitar" searches about 1.8x.
So the plan writes itself: cut First Song Free back to a test budget, move every creator onto code-based terms, and put the savings into search terms and referral credits. The plan as drafted adds 45% more to paid social next year. That's the line I'd change first.
Count what the app stores keep
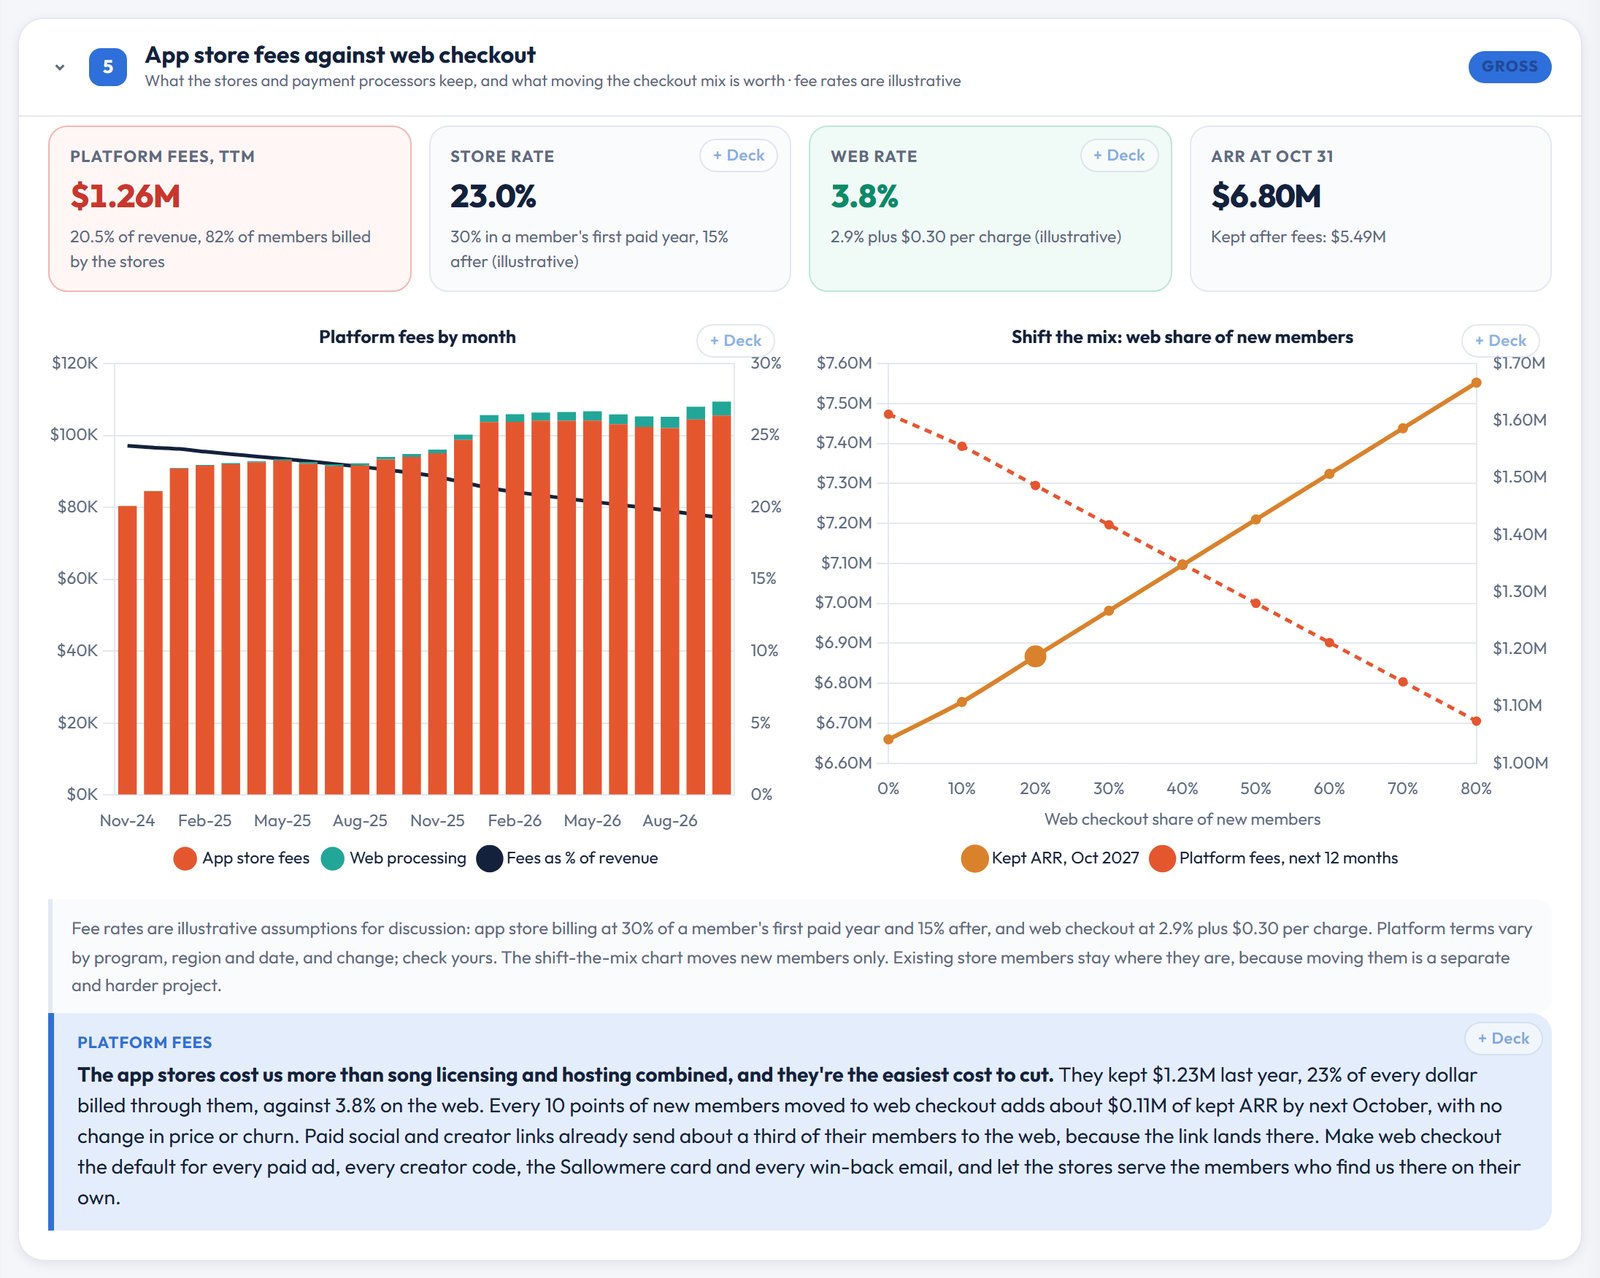
The stores kept $1.23M last year, 23% of every dollar billed through them (the demo's rates are illustrative), against 3.8% on the web checkout. That's more than Tonehollow spent on song licensing and hosting combined. Every 10 points of new members moved to the web adds about $0.11M of kept ARR by next October, with no change to price or churn. Paid social and creator links already send about a third of their members to the web, because that's where the link lands. Make it the default for every ad, every creator code, the Sallowmere card and every win-back email.
January is the financing event
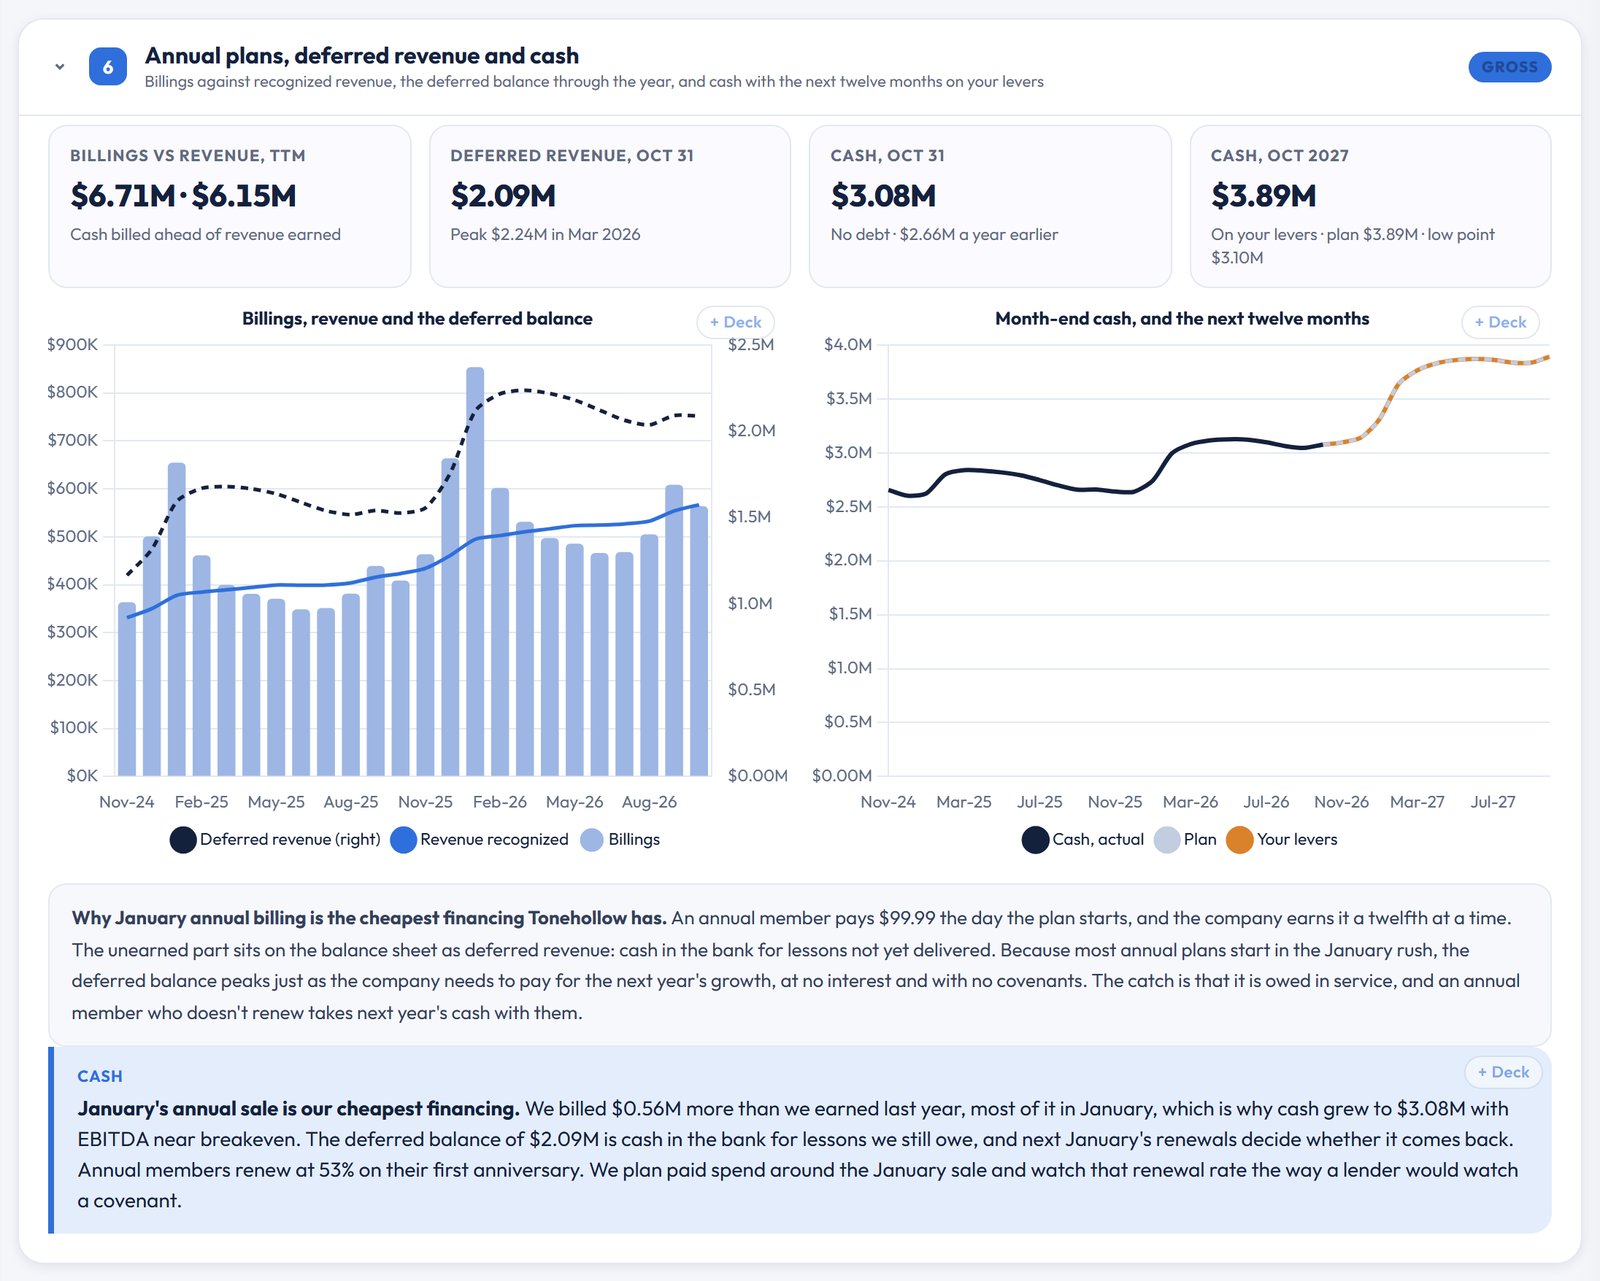
Tonehollow billed $0.56M more than it earned last year, most of it in January as annual plans paid up front. That's why cash grew to $3.08M with EBITDA near breakeven. The $2.09M of deferred revenue is cash in the bank for lessons still owed, and annual members renew at 53% on their first anniversary. I'd plan paid spend around the January sale and watch that renewal rate the way a lender watches a covenant.
The cheapest member is the one who comes back
The Come Back and Play emails started in November 2025 with a $69.99 annual offer to lapsed members. Reactivations went from 1,851 to 4,470 in a year and brought in $340K with no media cost. Seven in ten come back through the web checkout. That program deserves its own budget line and a target.
Scenarios, the exit lens and the board deck
The levers on the left act on the next twelve months only. On the plan, kept ARR reaches $6.90M by October 2027 with $0.43M of EBITDA. Set paid social to about 70% of plan, which holds it at this year's spend, and EBITDA rises to about $0.75M for about $0.1M less kept ARR. The exit lens then prices what a buyer would: kept ARR, not the dashboard's number. At an illustrative 3.0x, the fees alone cost about $3.9M of value.
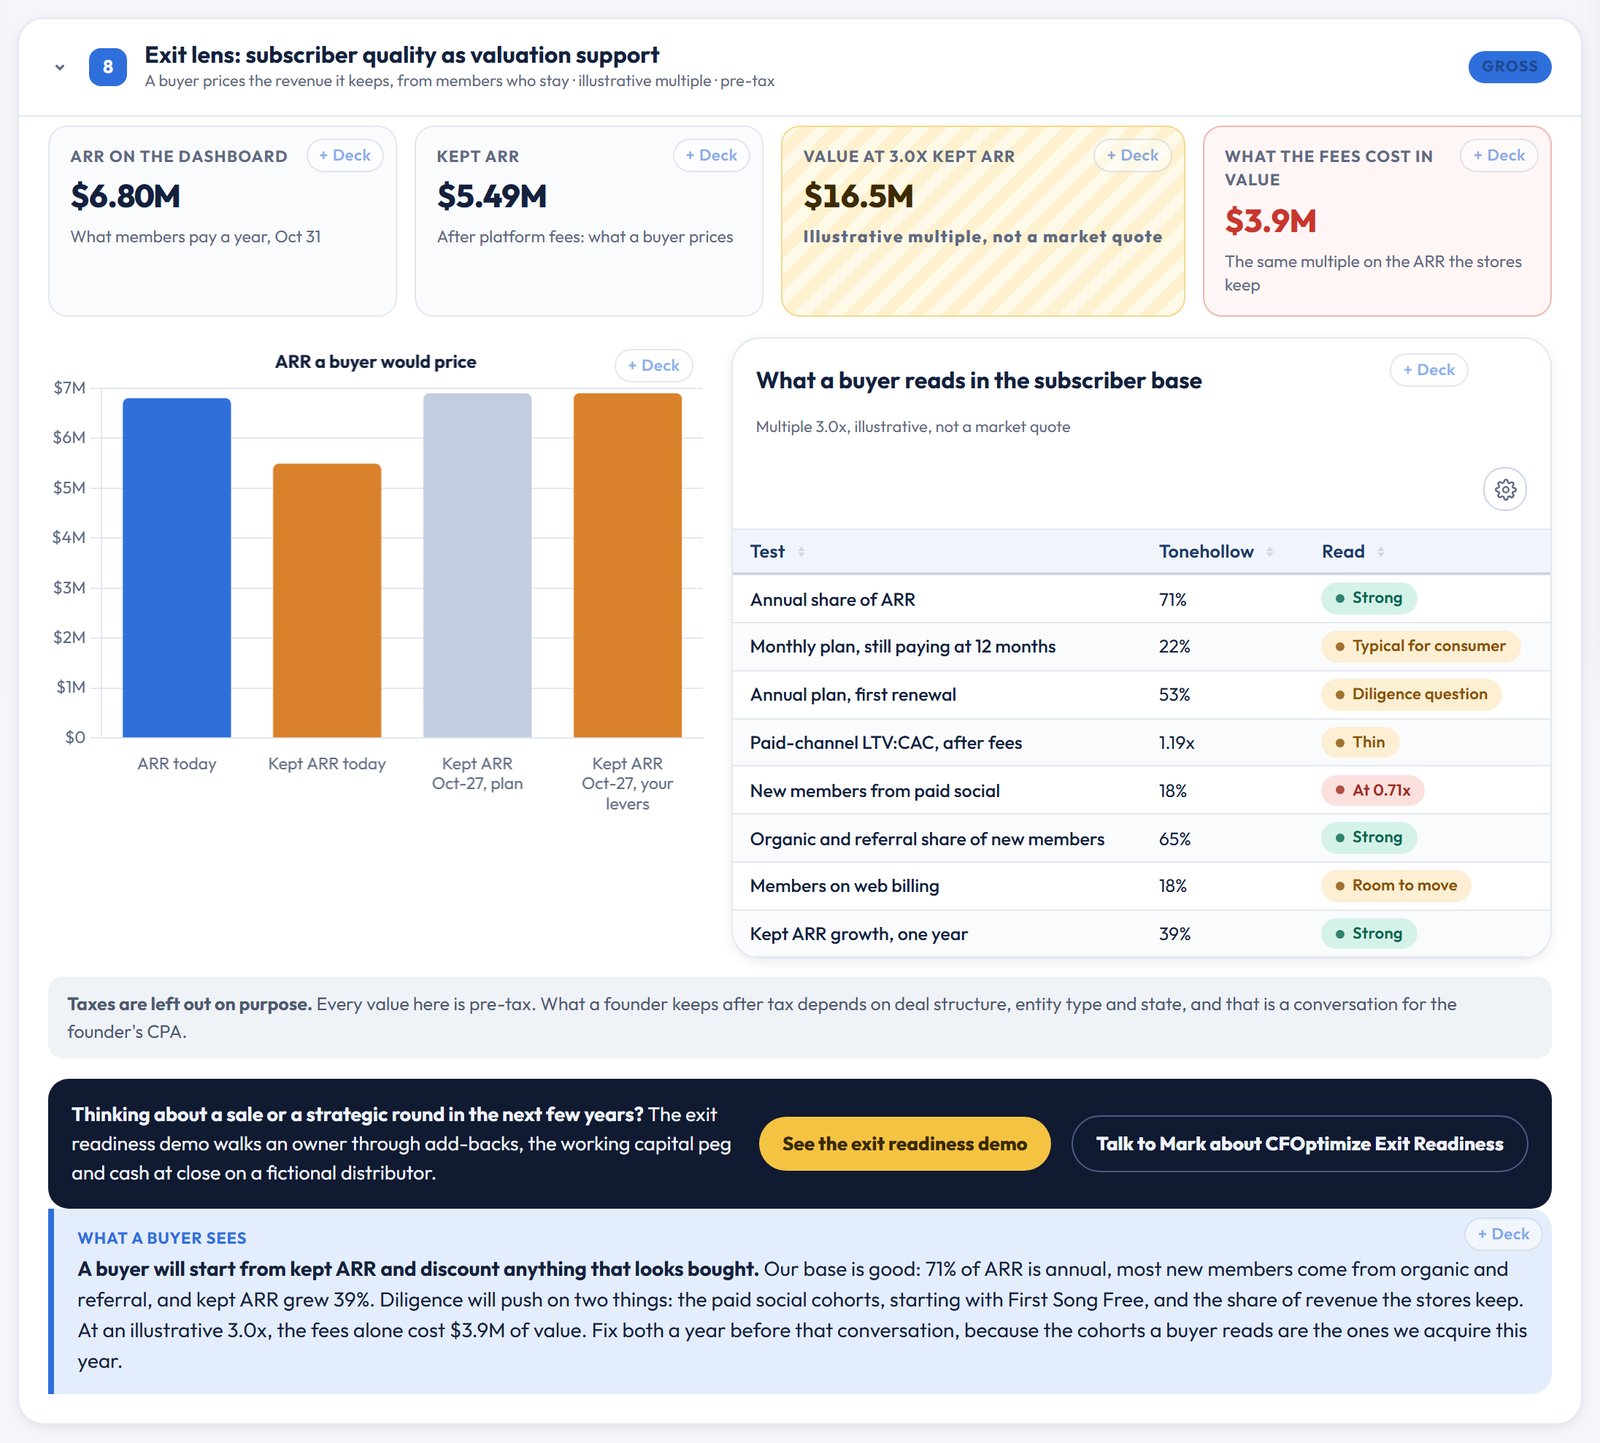
Every card, chart and table has a + Deck button, and the subscriber economics pack builds an editable PowerPoint with speaker notes that record which view and levers were active.
Why not just do this yourself with AI?
You should use AI. We do, every day. The analysis was never the hard part. Every finding above came from four things a chatbot doesn't have:
- Transaction-level data, kept current. Every member's start month, channel, plan and checkout, pulled from the app store and web billing reports, the ad accounts and the accounting system after every close, and tied to the books.
- Context nobody wrote down. That First Song Free was scaled in September, that the Sallowmere card was in the January boxes, that one creator is paid per code and another isn't. We add that to the data so it sits next to the numbers it explains.
- Somewhere safe to keep it. Read-only connections, a secured warehouse you control and access controls, instead of subscriber exports pasted into a chat window.
- Someone accountable for it. A CFO who knows the business well enough to cut a campaign the marketing team loves, and to show the board why.
What it takes to get this on your own numbers
We connect read-only to your app store and web billing reports, your ad accounts and your accounting system, rebuild every cohort from the first subscriber forward, and tie revenue, fees and deferred revenue back to the books. From then on it refreshes after every close, so a channel buying members at a loss shows up in weeks instead of at year end.
That's CFOptimize – accelerate your growth, built for subscription founders who want to know which growth is worth buying. If you'd like to see it on your own cohorts, grab time with me, or browse the other demos in our showcase.
Mark
Tonehollow and every partner, creator, campaign and program named in this post are fictional, and every figure in the dashboard and in this post is invented for illustration. Nothing here is drawn from any client's books. Platform fee rates, price and spend responses and the valuation multiple are illustrative assumptions, not quotes or platform terms, and nothing here is tax, legal or investment advice.
Share