Owners of $20 to 100M commercial and specialty contractors with bonded work, and the surety brokers, construction CPAs and bankers who read their numbers.
Whether the profit on the books is real, where fade is hiding in the WIP, and whether the surety will back the next bid.
Surety season starts with a short email: please send the September WIP schedule before we renew the program. For a contractor about to bid the biggest job in its history, that one schedule decides whether the bond is there. And the question the owner should be asking isn't "how big is my backlog?" It's "which of my estimates is wrong, and what does fixing it do to my bonding line?"
AI can summarize a contractor's P&L in seconds. It can't answer that question, because the answer isn't in the P&L. It's in job cost by cost code, payroll hours by job, the quantities the field has actually put in place and the change-order log, and somebody has to line those up every month.
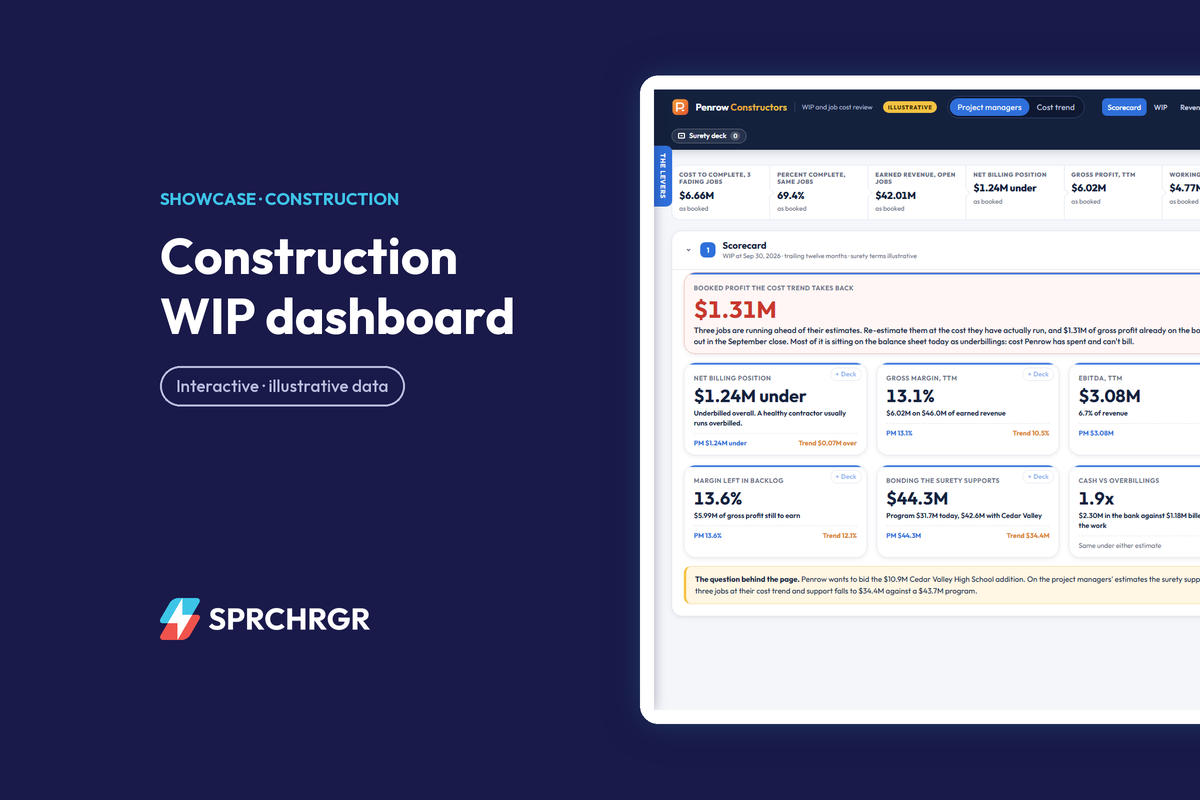
Here's how I'd walk an owner through it using a working sample dashboard we built for a fictional contractor called Penrow Constructors: 27 years old, second-generation, concrete and site work, 150 people in the field and mostly bonded public work. The company, its jobs, its people and its numbers are invented. The patterns aren't. A switch at the top flips every section between the project managers' estimates and what each job's cost trend says, so open it in another tab and follow along.
The quarter, the way I'd say it to the surety
This is the paragraph at the top of the page, and it's the one I'd want the owner able to say without looking down:
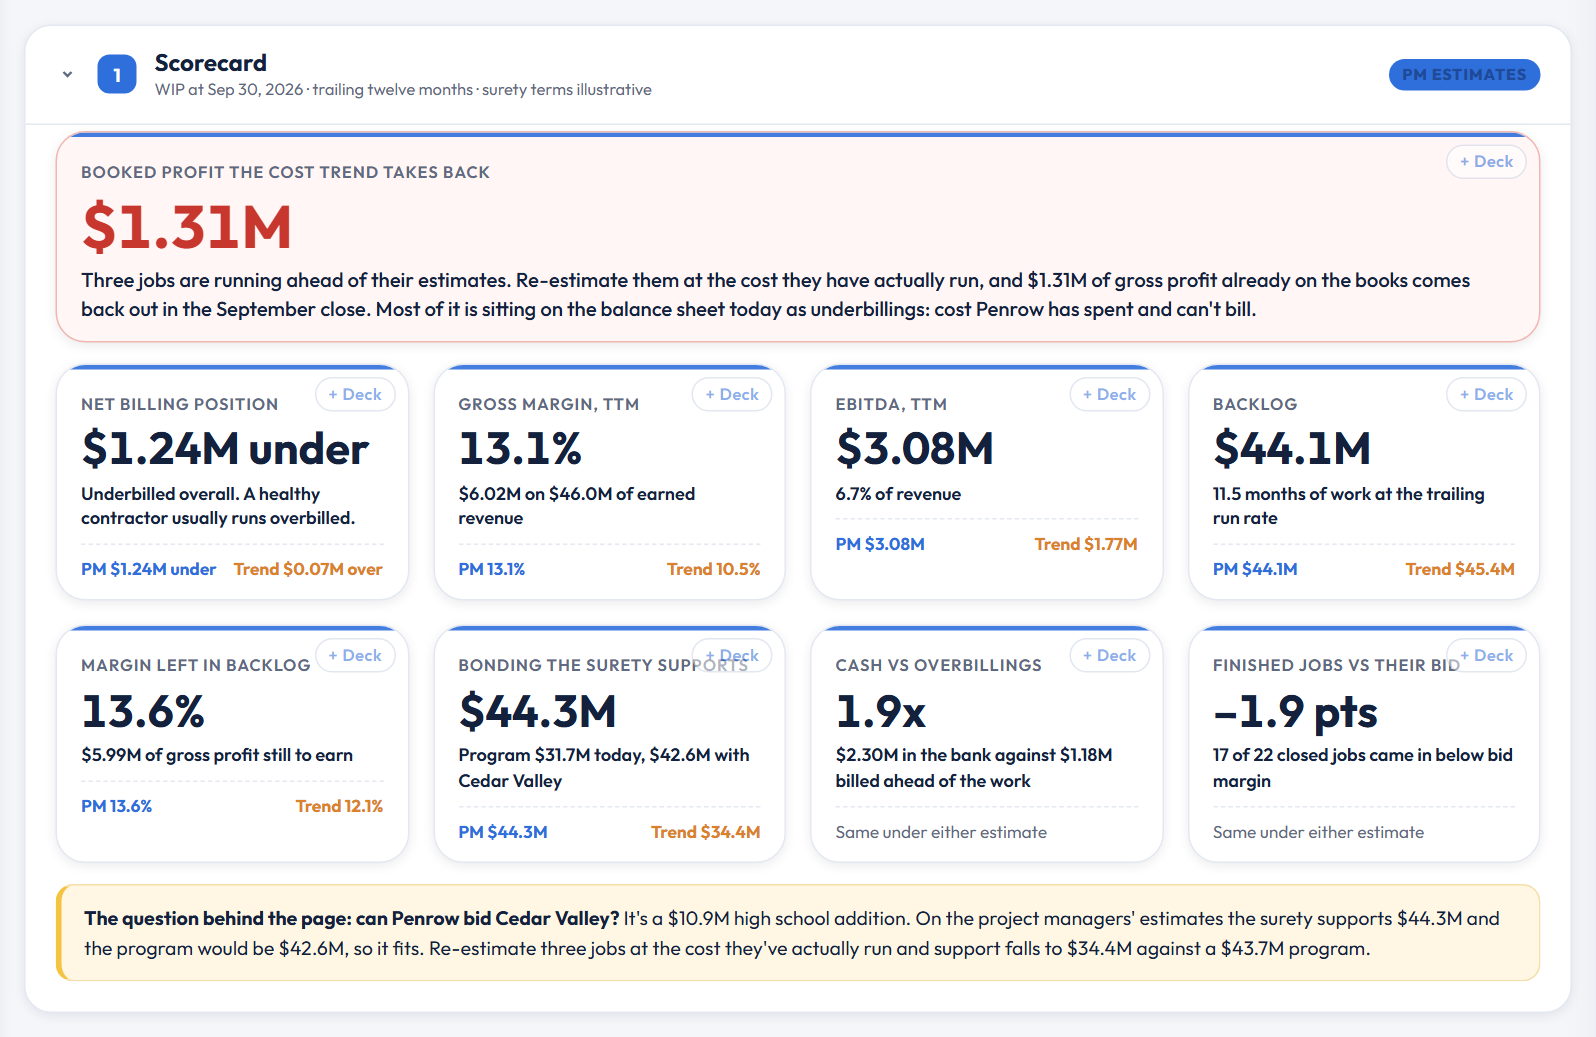
Penrow's best quarter is hiding $1.3M of fade, and its next bond depends on finding it first. Penrow earned $12.4M in the quarter to September, 47% more than a year ago, and $46.0M over twelve months at a 13.1% gross margin. Three jobs are running ahead of their estimates, mostly on field labor: re-estimate them at the cost they've actually run and $1.3M of booked profit comes back out in the September close. On those numbers the surety's support falls from $44.3M to $34.4M and the $10.9M Cedar Valley bid stops fitting, so the estimates get fixed before the WIP goes to the surety, not after.
The first sentence is what an AI summary would get right. Everything after it comes from the layer underneath.
Read the over/under column first
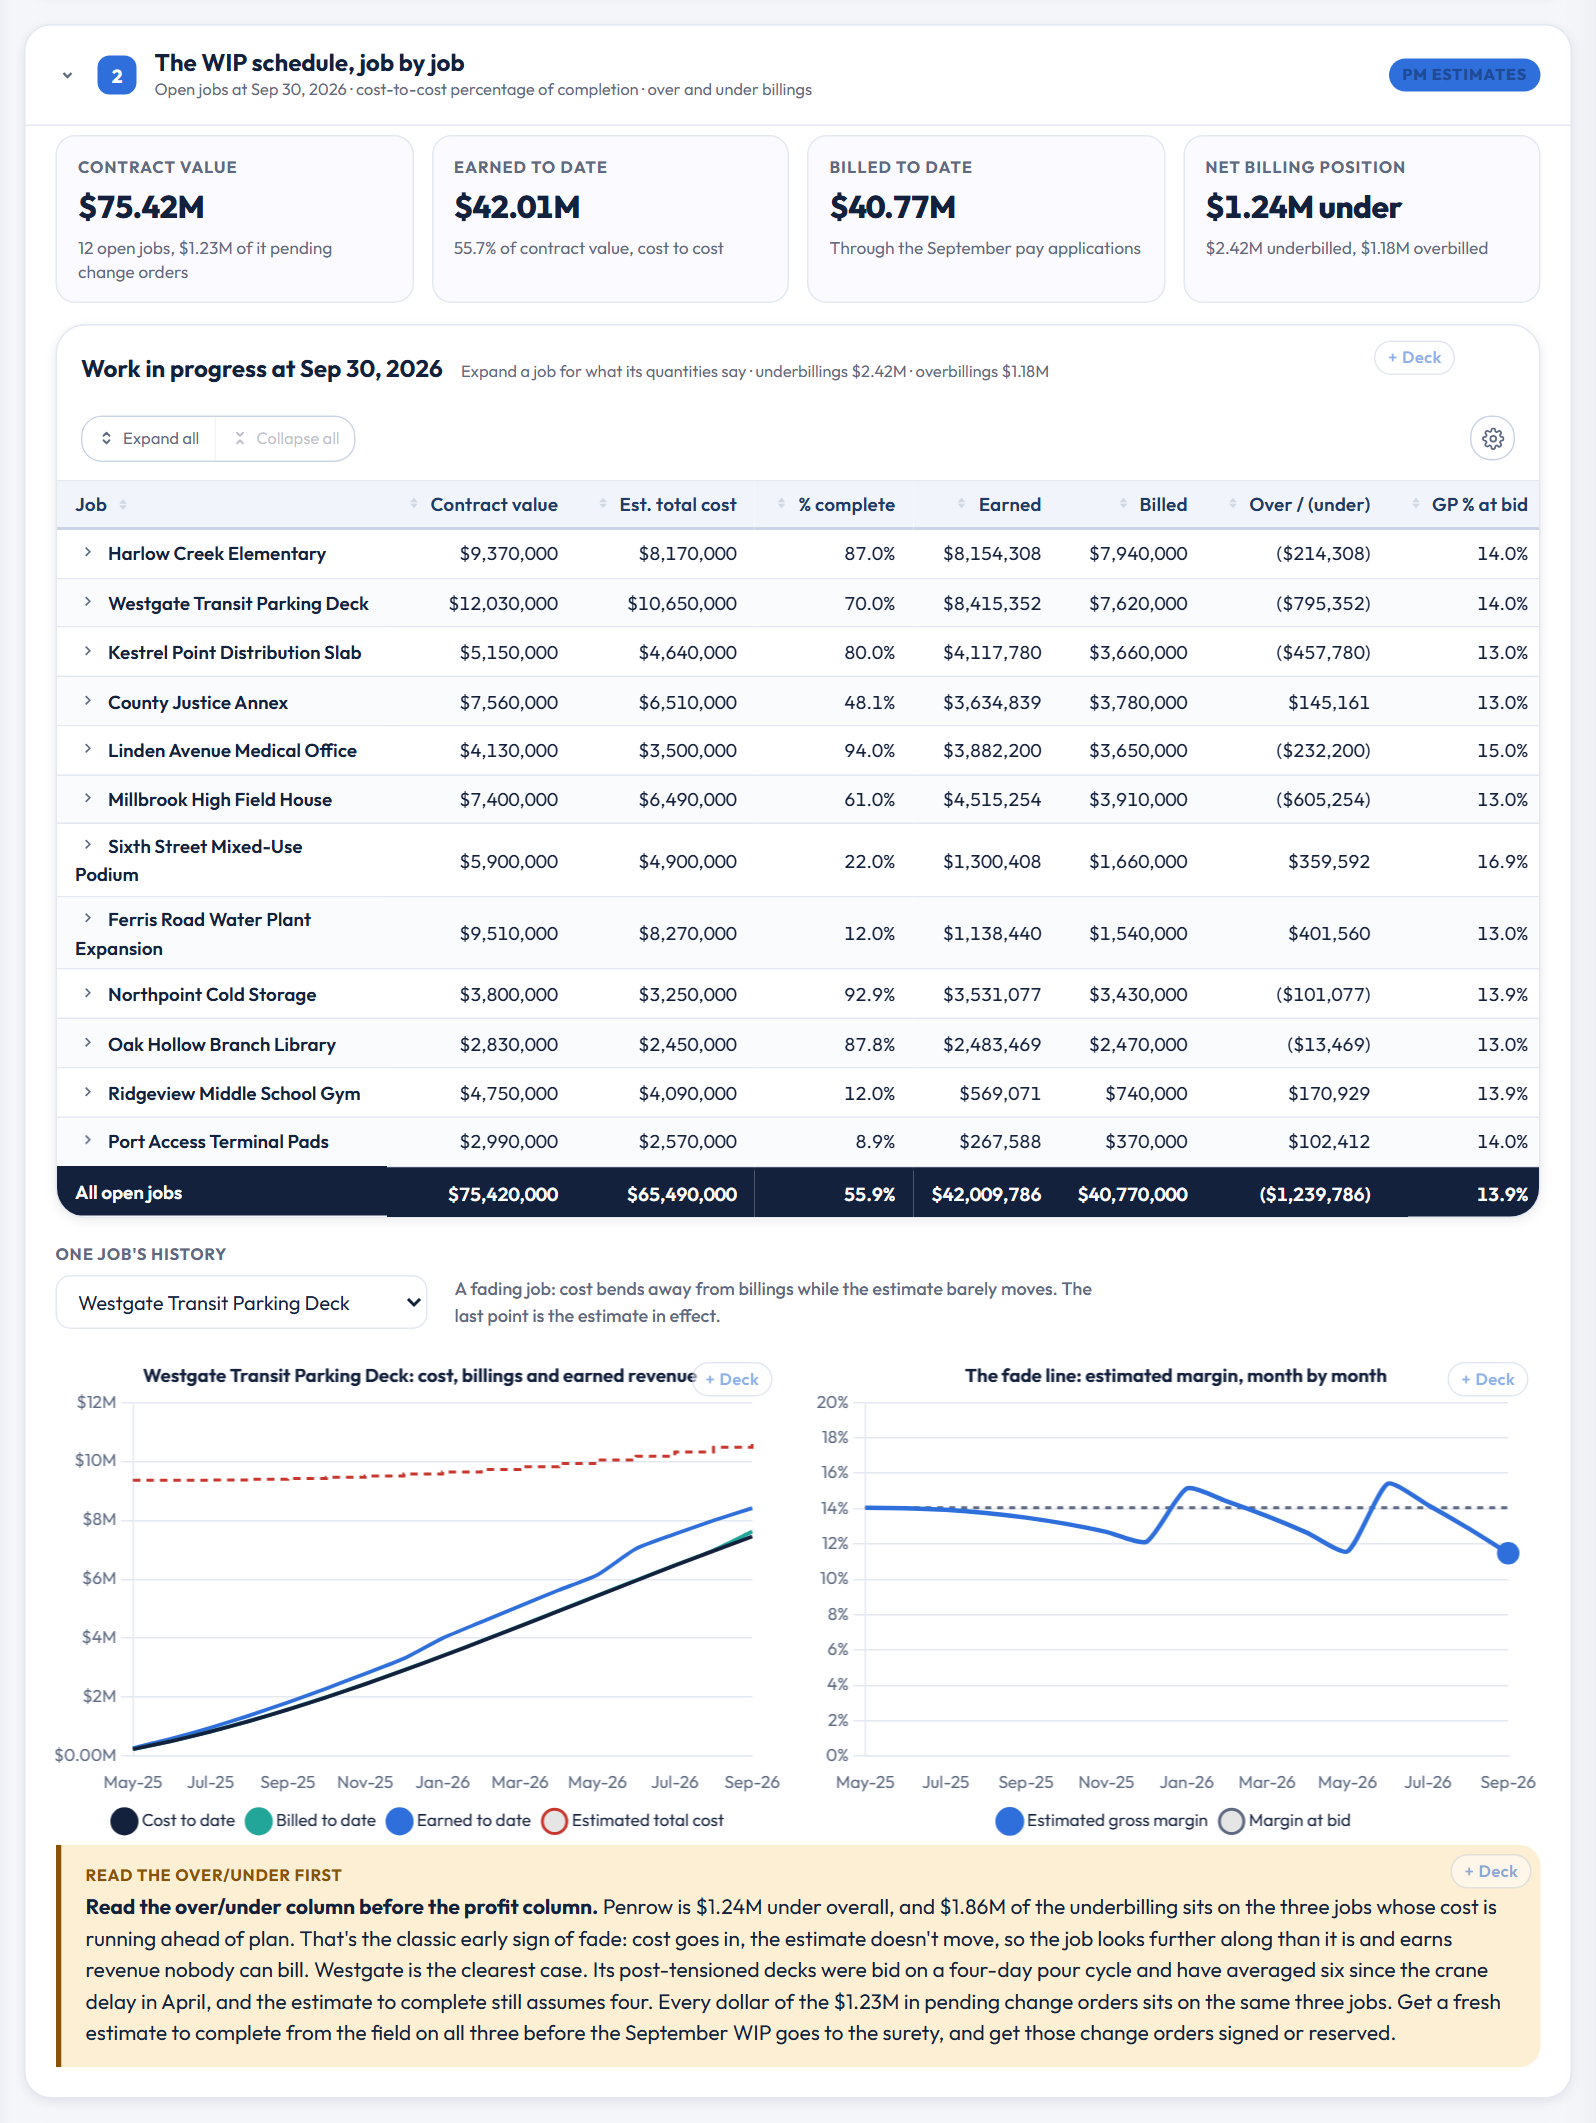
Penrow's 12 open jobs carry $75.42M of contract value, $42.01M earned to date and $40.77M billed. Read those last two together and you get the number a surety underwriter starts with. Penrow is underbilled by $1.24M overall: $2.42M of work done and not yet billed, against $1.18M billed ahead of the work. A healthy contractor usually runs the other way, and $1.86M of that underbilling sits on three jobs: the Westgate transit parking deck, the Kestrel Point distribution slab and the Millbrook High field house.
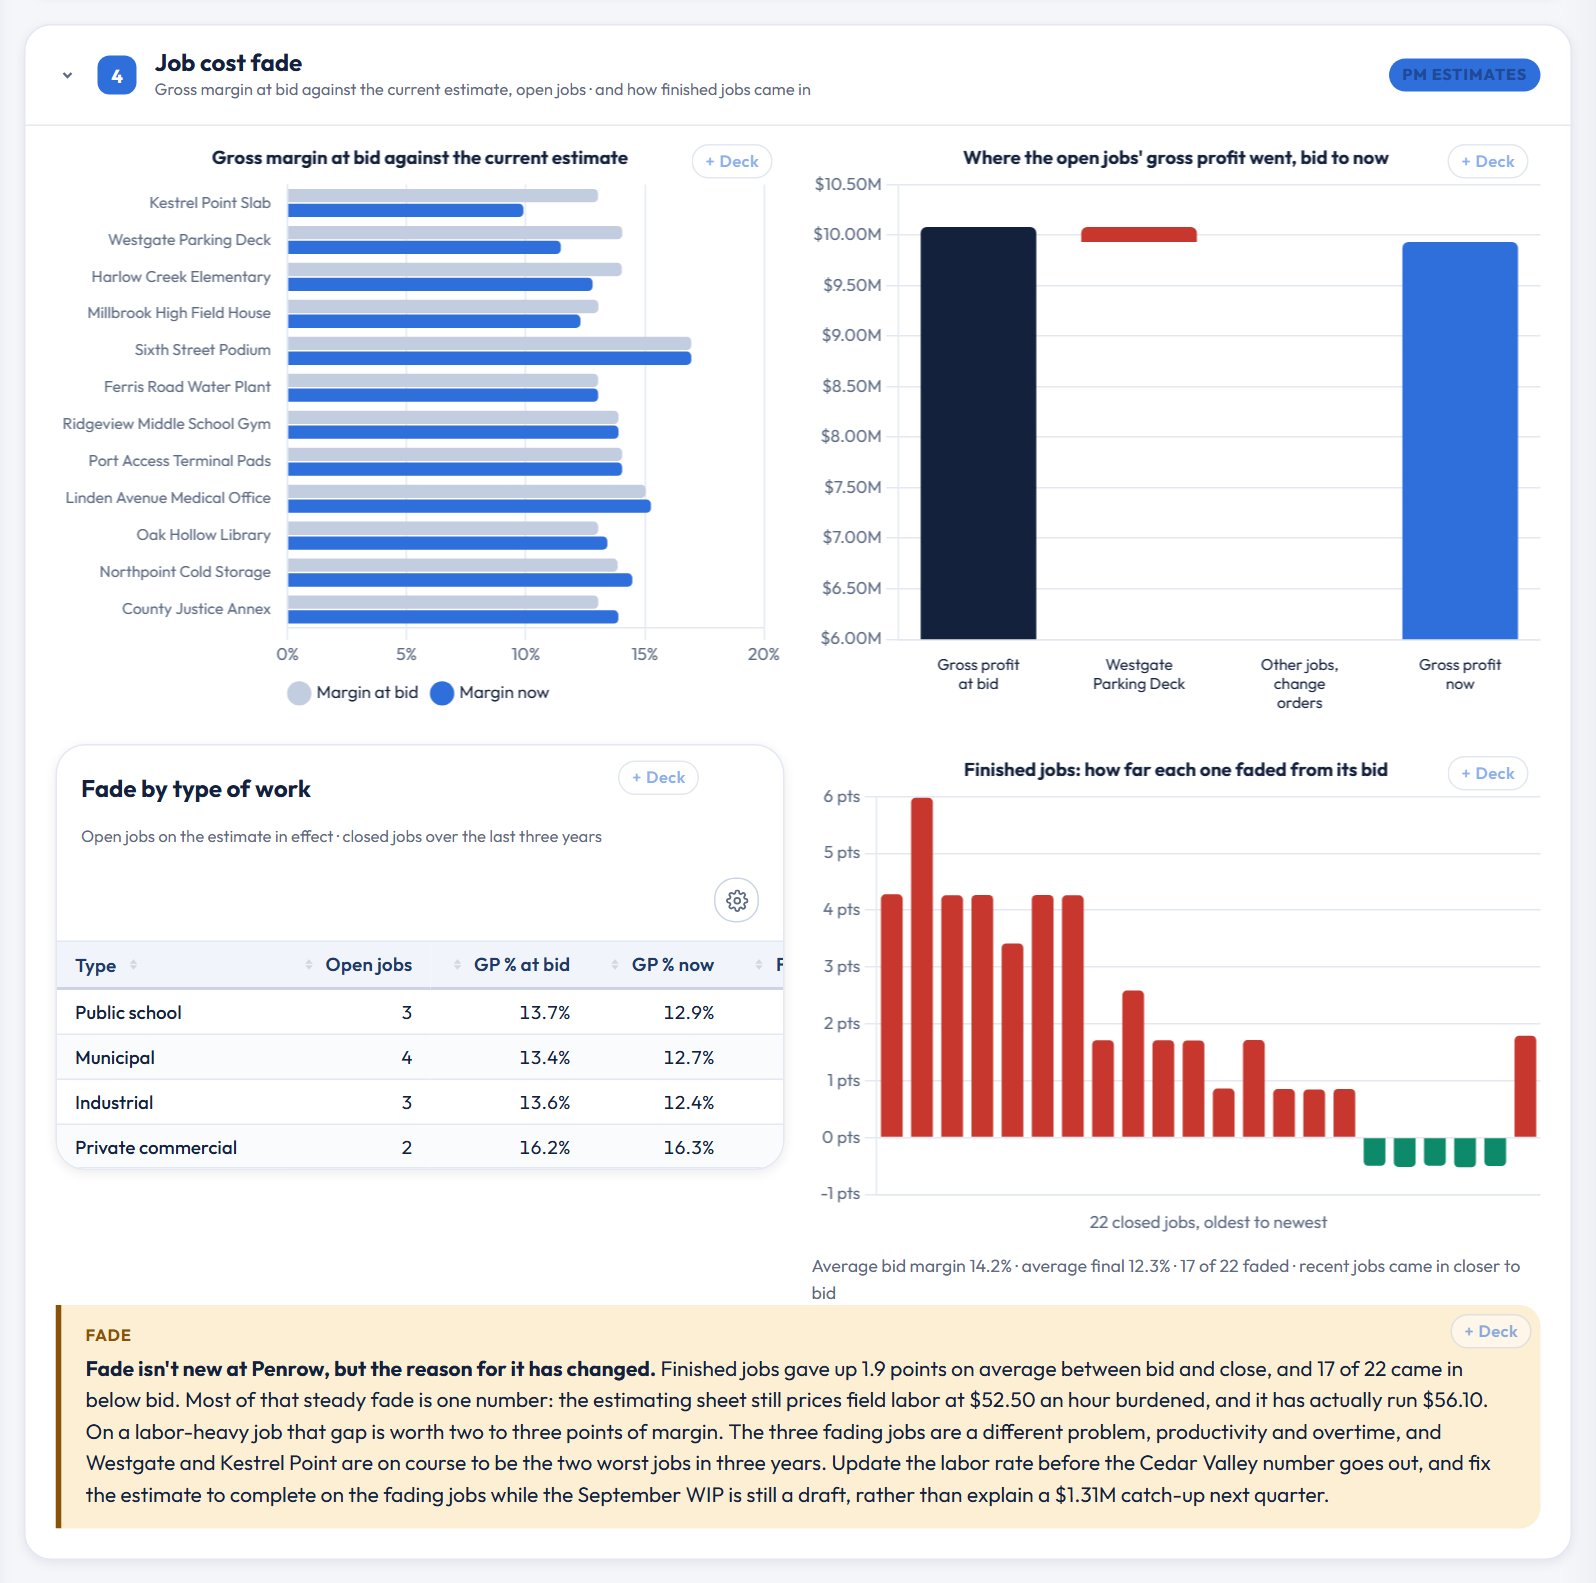
Westgate is the clearest case. Cost to date says the deck is 70% complete. The quantities in place say about 63%. Its post-tensioned decks were bid on a four-day pour cycle and have averaged six since a crane delay in April, and the estimate to complete still assumes four. One more thing the change-order log shows: every dollar of the $1.23M in pending change orders sits on the same three jobs. Unsigned change orders on fading jobs are the first thing I'd want signed or reserved.
What one estimate does to everything after it
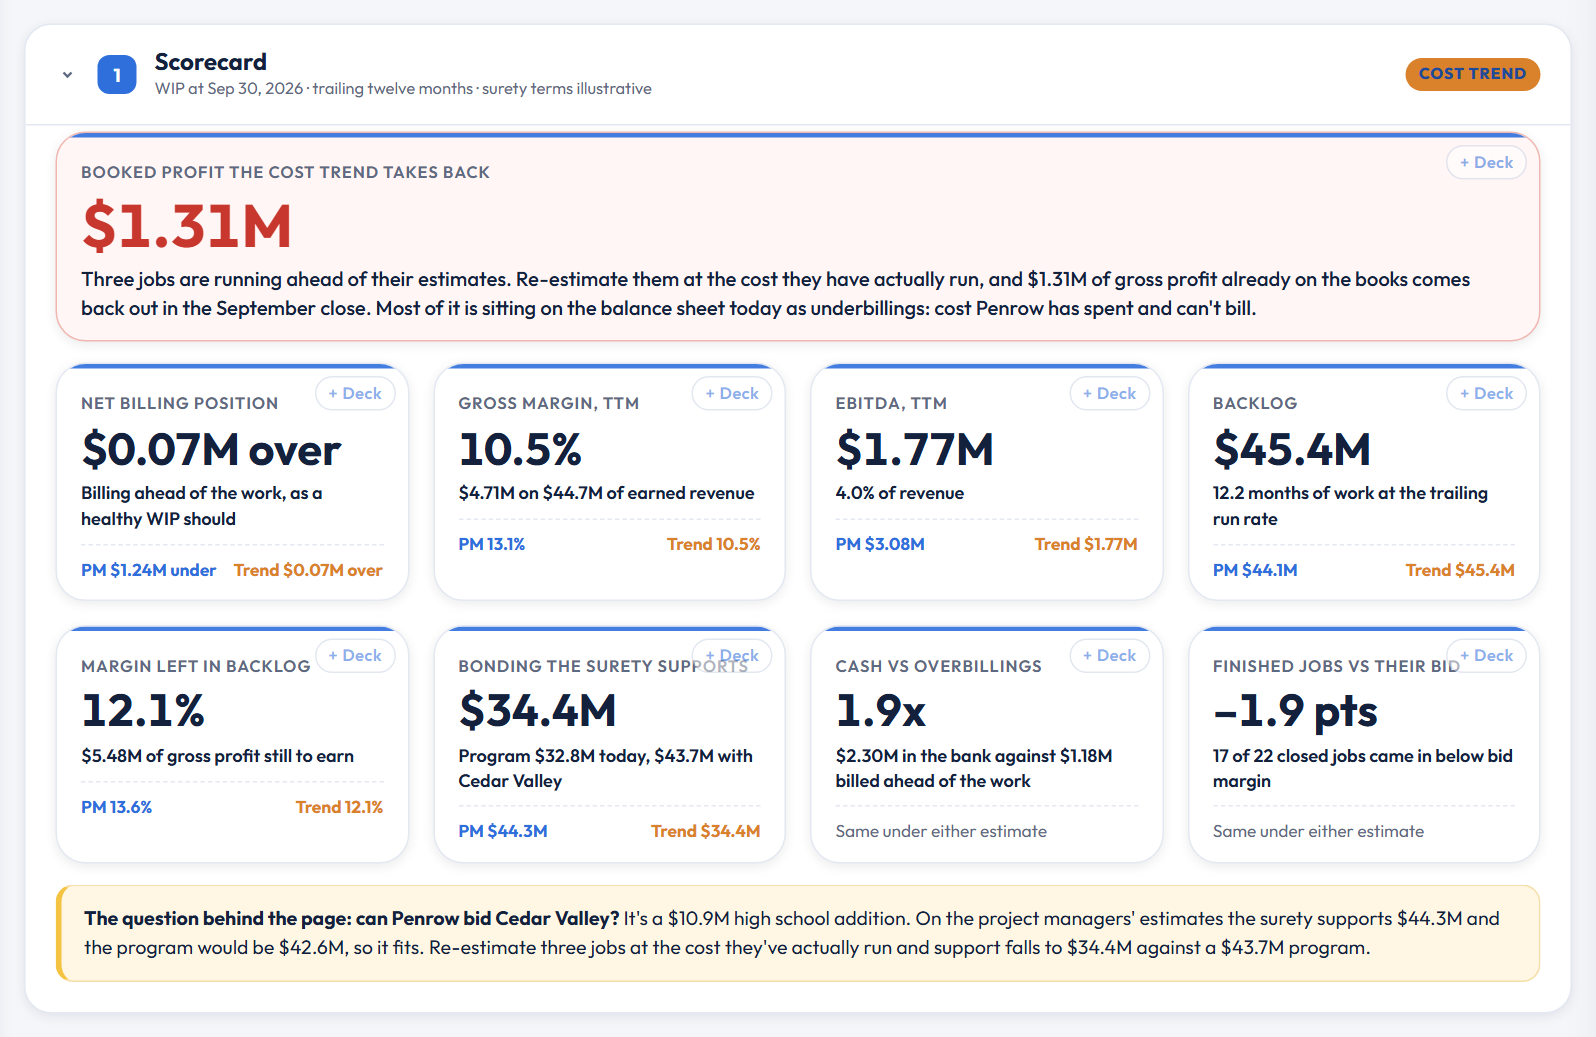
Under cost-to-cost percentage of completion, a job is as complete as its cost to date divided by its estimated total cost, and revenue is that share of the contract. So the estimate to complete also sets revenue you've already booked. Flip the switch to the cost trend and the three fading jobs are re-estimated at the cost per unit each has actually run. Gross profit falls from $6.02M to $4.71M, EBITDA from $3.08M to $1.77M, and the $1.24M net underbilling turns into a small net overbilling. Every month before September is closed and never moves. September is the close being prepared, and it's where that catch-up lands.
Why the jobs fade, and why it's a labor story
Penrow's 22 finished jobs were bid at 14.2% on average and closed at 12.3%, and 17 of the 22 came in below bid. Most of that steady fade traces to one number. The estimating sheet still prices field labor at $52.50 an hour burdened, and payroll says it has actually run $56.10, 6.9% more. On a labor-heavy job that gap is worth two to three points of margin, which is most of the fade on the finished jobs.
The three jobs fading now are a different problem: productivity and overtime. The new field labor section on the page shows it from payroll. Field labor is $16.8M a year, 42% of job cost. On the three fading jobs, labor explains $852K of the $1.16M they've spent beyond what the work in place should have cost. Westgate's crew has worked Saturdays since June to hold the pour schedule, and overtime there is 19% of labor cost against 8% across the company. Kestrel Point and Millbrook have shared one superintendent, Toby Marchetti, since the Kestrel superintendent left in May, and both started slipping the month after.
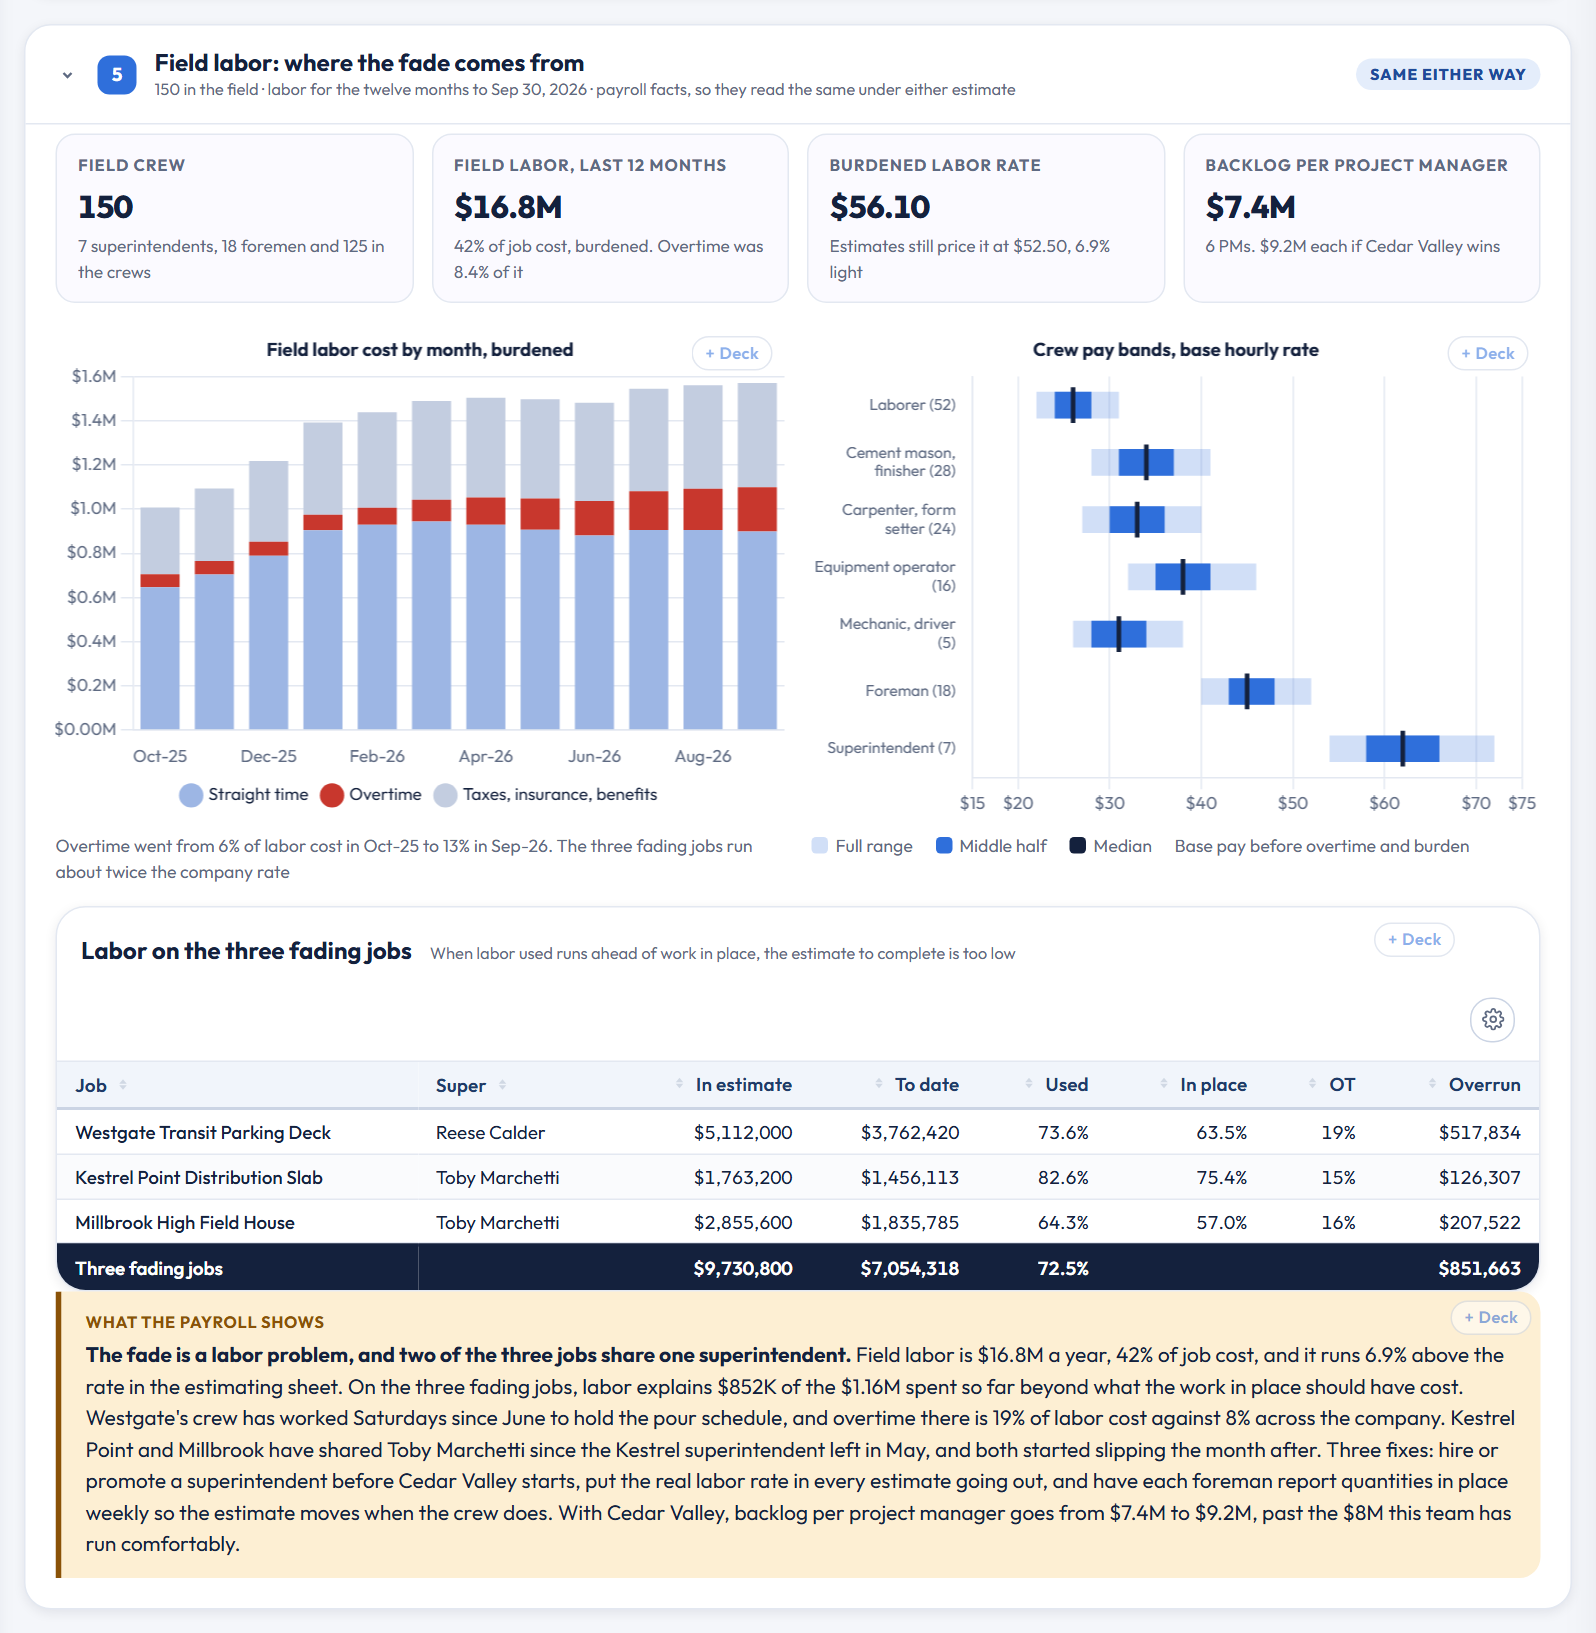
None of that is in the financial statements. It's in payroll hours by job and the superintendent assignments, and it points to three fixes: hire or promote a superintendent before Cedar Valley starts, put the real labor rate in every estimate going out, and have each foreman report quantities in place weekly so the estimate moves when the crew does. The headcount math says the same thing from the other side. Backlog per project manager is $7.4M today and goes to $9.2M if Cedar Valley wins, past the $8M this team has run comfortably.
Have the bonding conversation with real numbers
Penrow has $44.1M of backlog, about a year of revenue. The surety terms in the demo are illustrative: a $45M aggregate limit, a $12M single-job limit, support at 15 times adjusted working capital and 50% credit for underbillings. Every surety writes its own, so treat them as a frame for the conversation rather than a quote. On the project managers' estimates adjusted working capital is $2.95M, which supports $44.3M, and with Cedar Valley the program would be $42.6M. It fits with $1.6M to spare. On the cost trend support drops to $34.4M against a $43.7M program, and Cedar Valley misses by $9.3M.
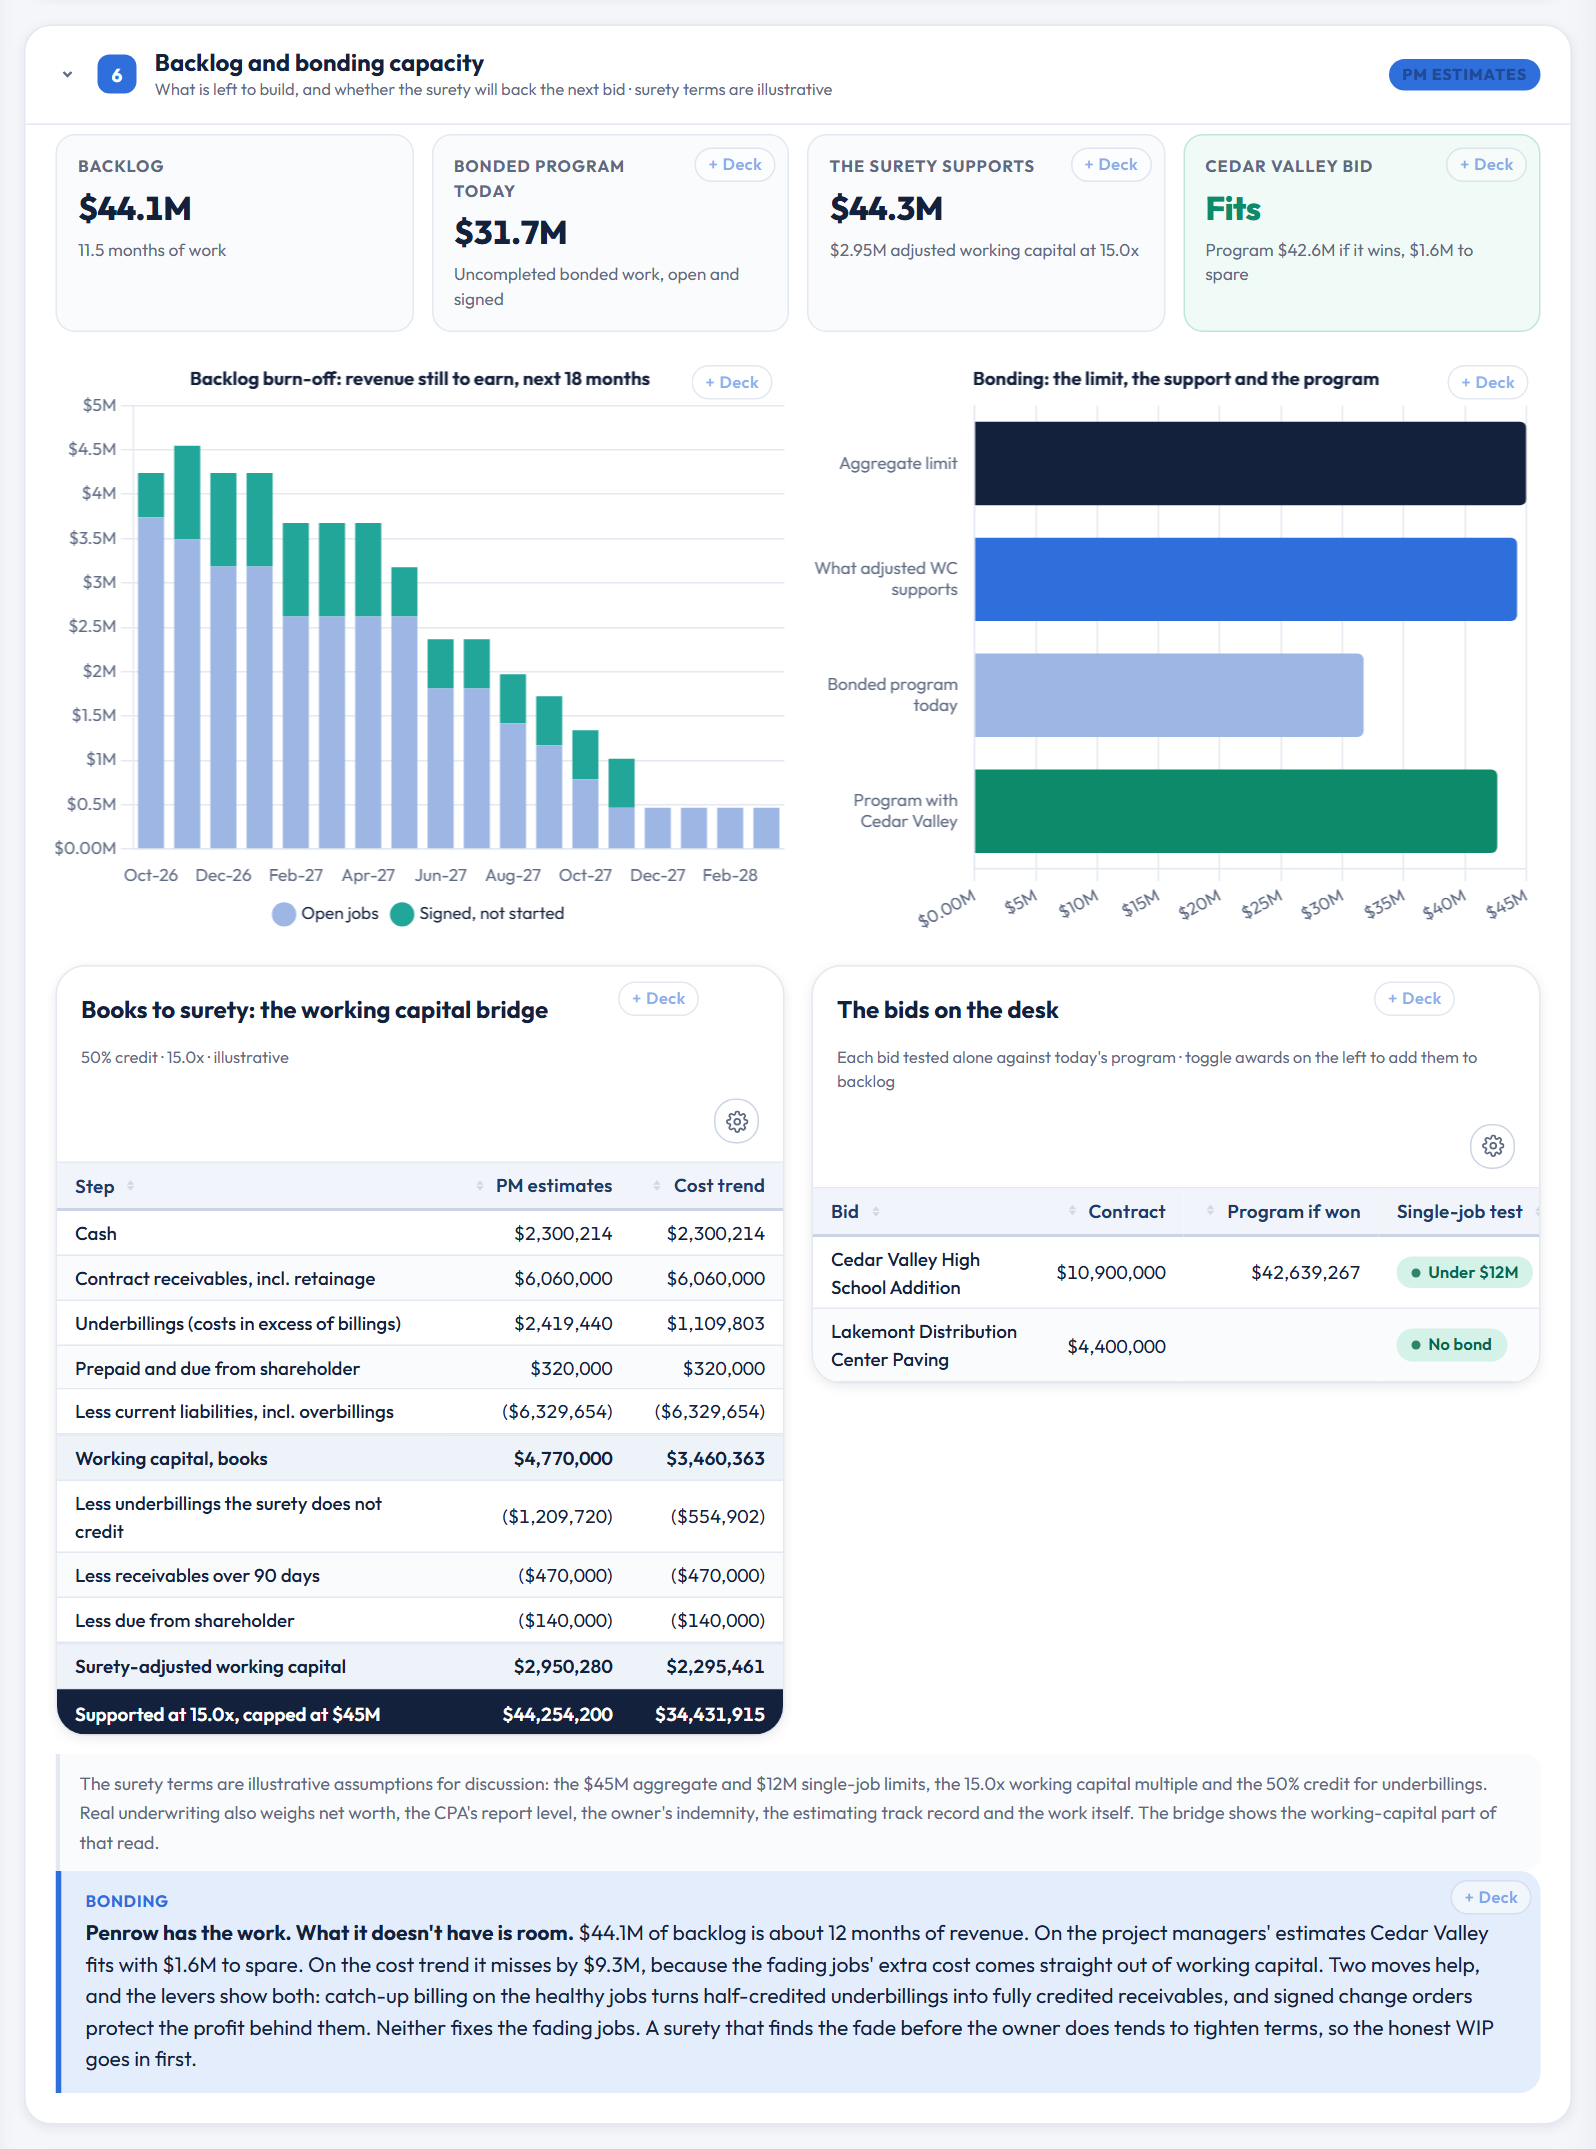
The levers that help are billing and paperwork. Catch-up billing on the healthy jobs moves $0.56M of underbilling into receivables, which the surety credits in full, and signed change orders protect the profit behind them. Neither fixes a fading job. A surety that finds the fade before the owner does tends to tighten terms, so the honest WIP goes in first.
Cash, and what a buyer would see
Cash is $2.30M against $1.18M of overbillings, about 1.9 times, so Penrow isn't spending its customers' money. The trend underneath is less comfortable. Underbillings grew from $0.2M to $2.4M over two years while revenue grew, and another $3.4M is sitting in retainage. On the cost trend more than half of that underbilling is overrun no pay app will ever collect.
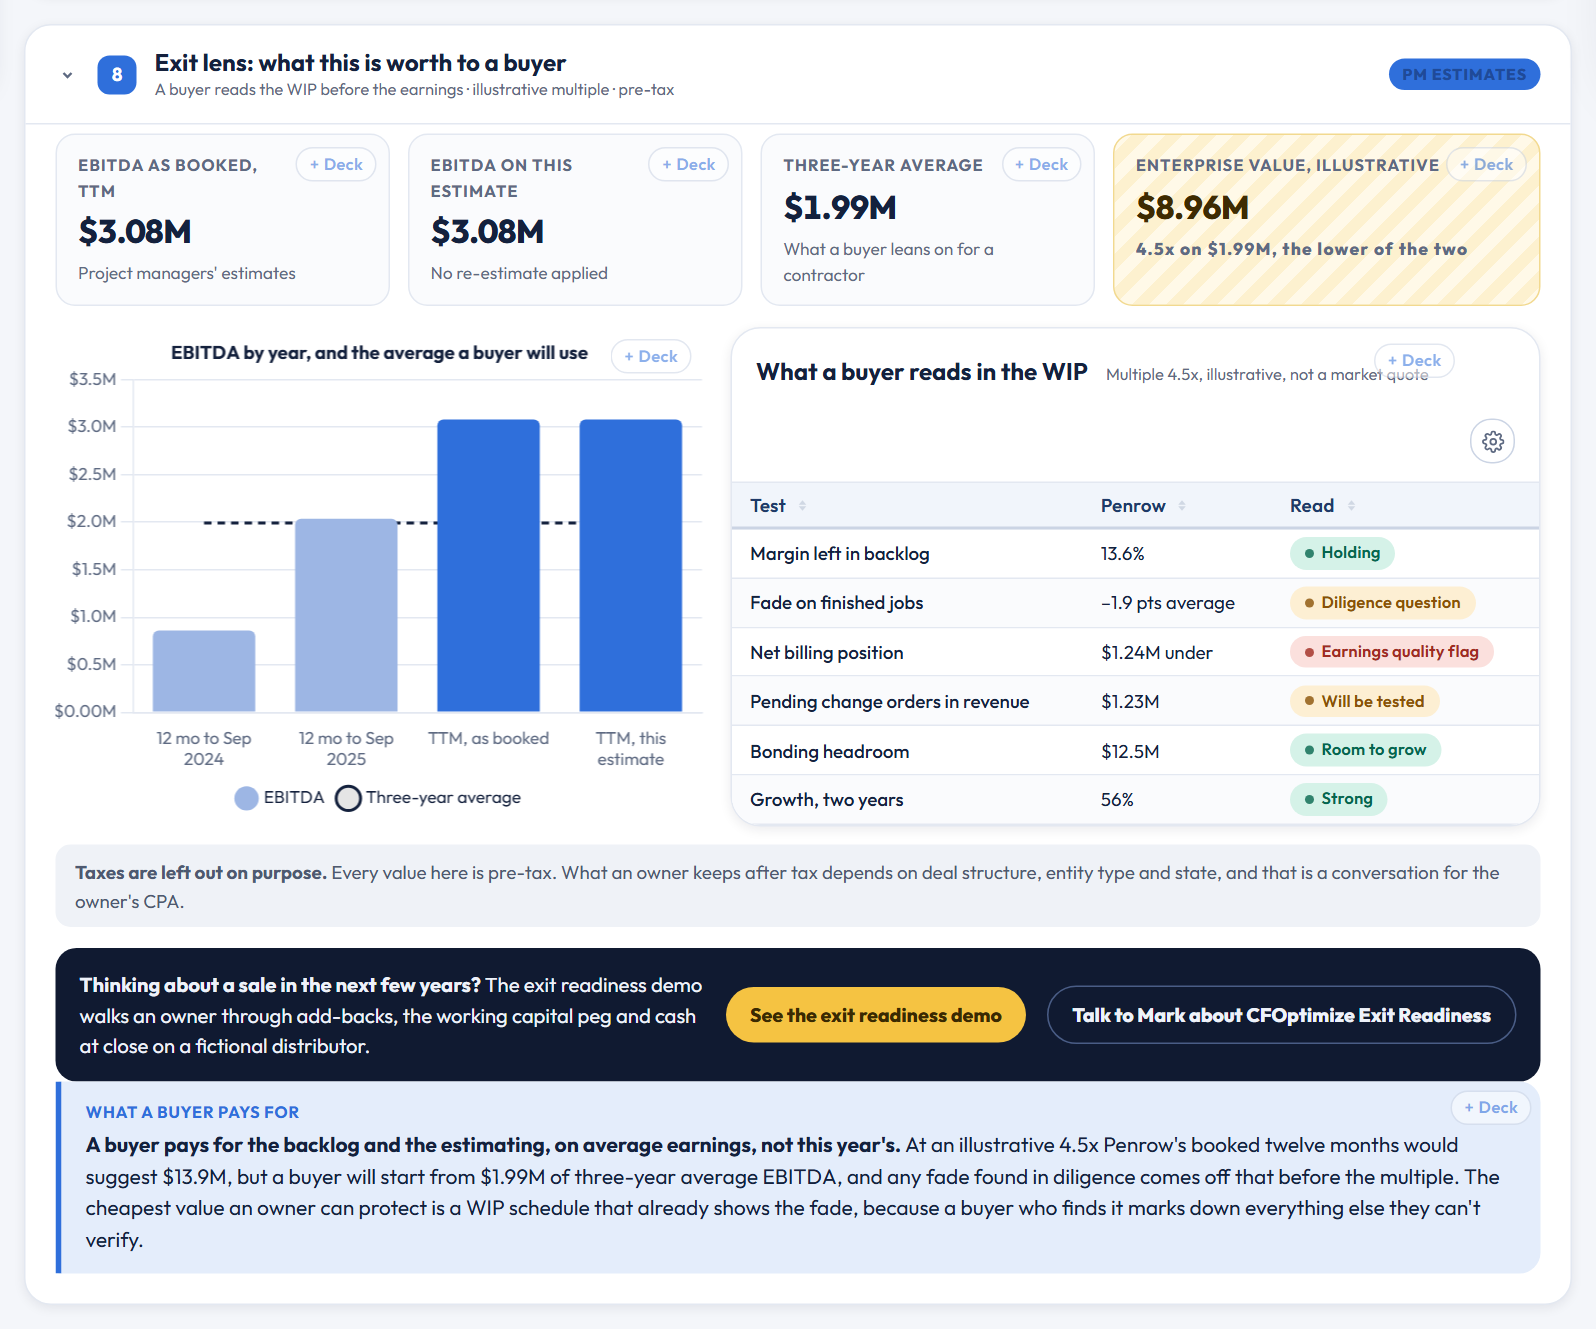
A buyer reads the same WIP. Contractor earnings swing with the estimates, so a buyer leans on the three-year average, which is $1.99M. At an illustrative 4.5x that's about $9.0M, against the $13.9M the booked twelve months alone would suggest. A WIP schedule that already shows its fade is worth more than one that looks better and has to be re-cut in diligence. If a sale is on the horizon, the exit readiness demo walks through the rest of that conversation.
The scenarios and the surety review deck
The levers on the left let you set your own estimate to complete on each fading job, keep only part of the pending change orders, turn on catch-up billing, add the bids on the desk to backlog and move the surety terms. Every closed month stays locked while you do it. Every card, chart and table also has a + Deck button, and Use the surety review pack loads the set I'd bring to a surety or bank meeting as an editable PowerPoint, with speaker notes that record which estimate, change-order rate and surety terms were on.
Why not just do this yourself with AI?
You can do a fair amount of it yourself, and you should use AI. We use it every day. The analysis was never the hard part. Every finding above came from four things a chatbot doesn't have:
- Transaction-level data, kept current. Job cost by cost code, payroll hours by job and crew, billings, retainage and the change-order log, pulled automatically after every close and tied to the books.
- Context nobody wrote down. That a crane delay changed the pour cycle, that a superintendent left in May, that the estimating sheet's labor rate is two years old. We add that to the data so it shows up next to the number it explains.
- Somewhere safe to keep it. Read-only connections, a secured warehouse and access controls, instead of payroll files and job costs pasted into a chat window.
- Someone accountable for it. A CFO who has sat across the table from a surety underwriter and knows which numbers they'll test first.
Put those in place and the AI gets a lot more useful too, because it's finally reading the right data.
What it takes to get this on your own numbers
We connect read-only to your accounting, job-cost and payroll systems, rebuild the WIP schedule from your job costs, billings and change-order log, and test every estimate to complete against its cost trend and the quantities in place. Then we put it in the form your surety, your bank and your CPA read, and refresh it after every month-end close, so fade shows up while it can still be fixed.
That's CFOptimize, built for contractors who are growing into their bonding line. If you'd like to see it on your own jobs, grab time with me and we'll walk through your WIP together. You can also browse the other demos in our showcase.
Mark
Penrow Constructors and every job, customer and person named in this post are fictional, and every figure in the dashboard and in this post is invented for illustration. Nothing here is drawn from any client's books. Surety terms and multiples are illustrative assumptions, not quotes or underwriting standards, and nothing here is tax, legal, surety or investment advice.
Share