SaaS revenue quality dashboard
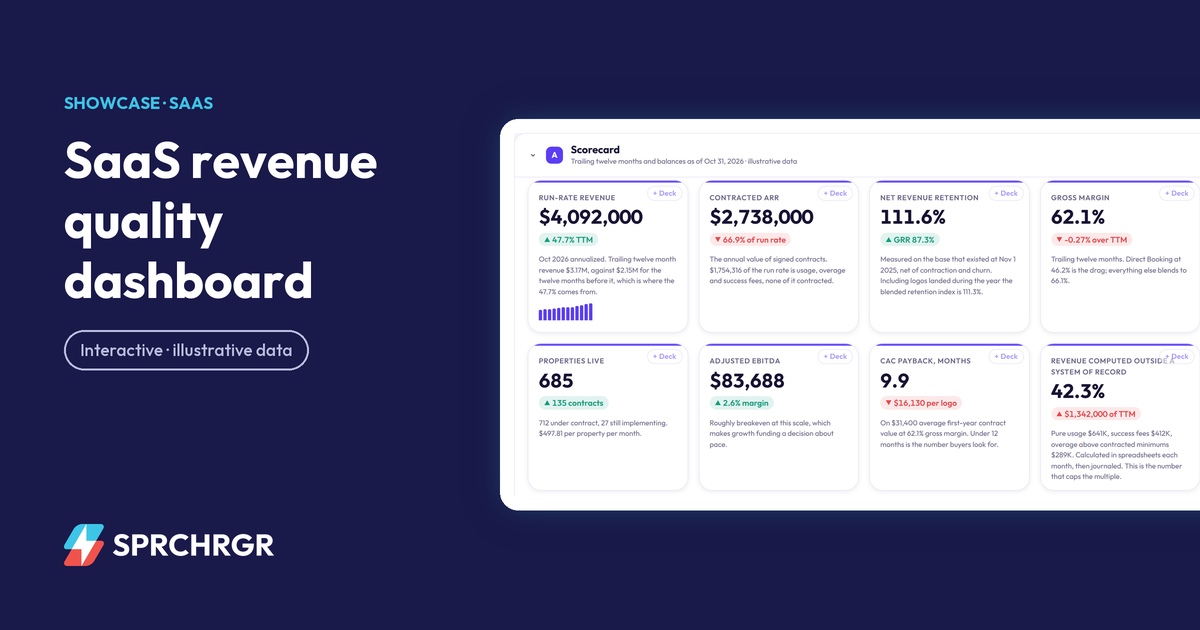
How much of the run rate is contracted, where ARR growth came from, and why billings, revenue and cash never match in a usage-priced SaaS business.
Transform raw data into clarity. Track your performance in real-time, compare industry metrics, spot trends, and navigate confidently with KPI dashboards customized for your business.

11 demos
How much of the run rate is contracted, where ARR growth came from, and why billings, revenue and cash never match in a usage-priced SaaS business.
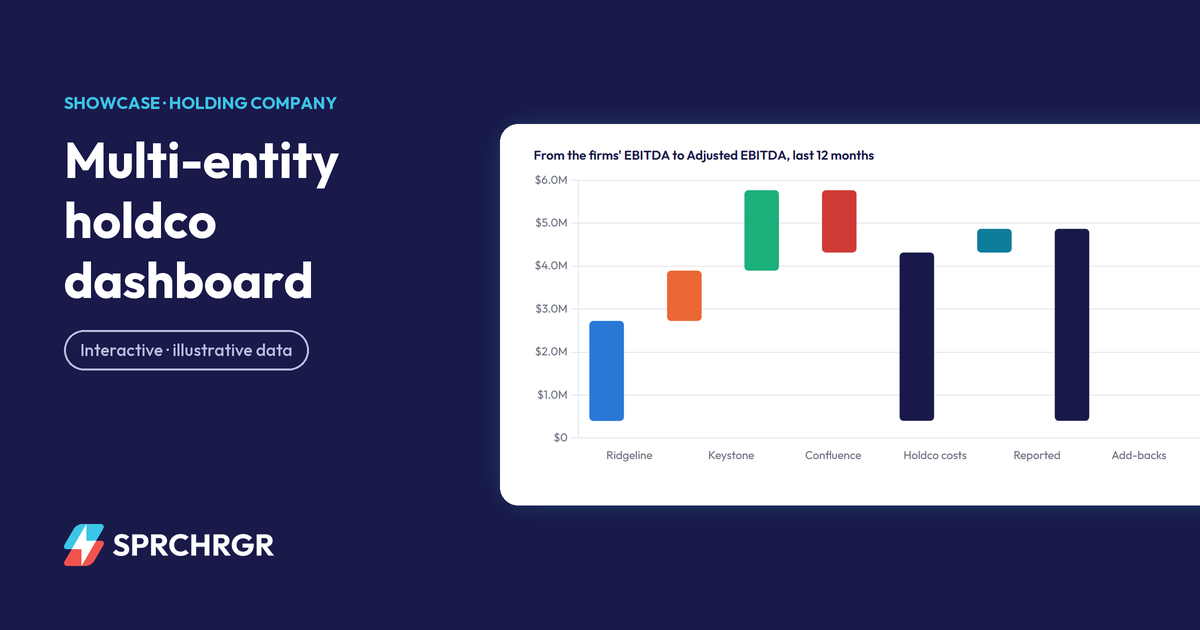
Three acquired firms on three ledgers, consolidated with intercompany eliminations, covenant tests and a what-if for the next acquisition.
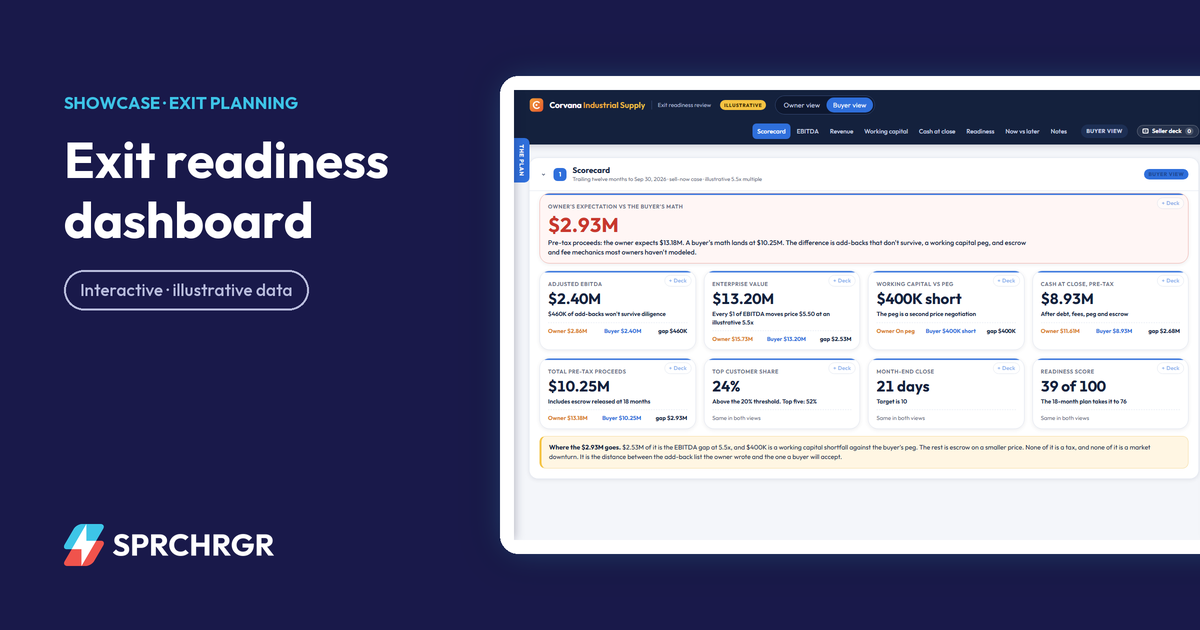
What a buyer will pay, which add-backs survive diligence, where the working capital peg lands, and how much cash reaches a founder at close.
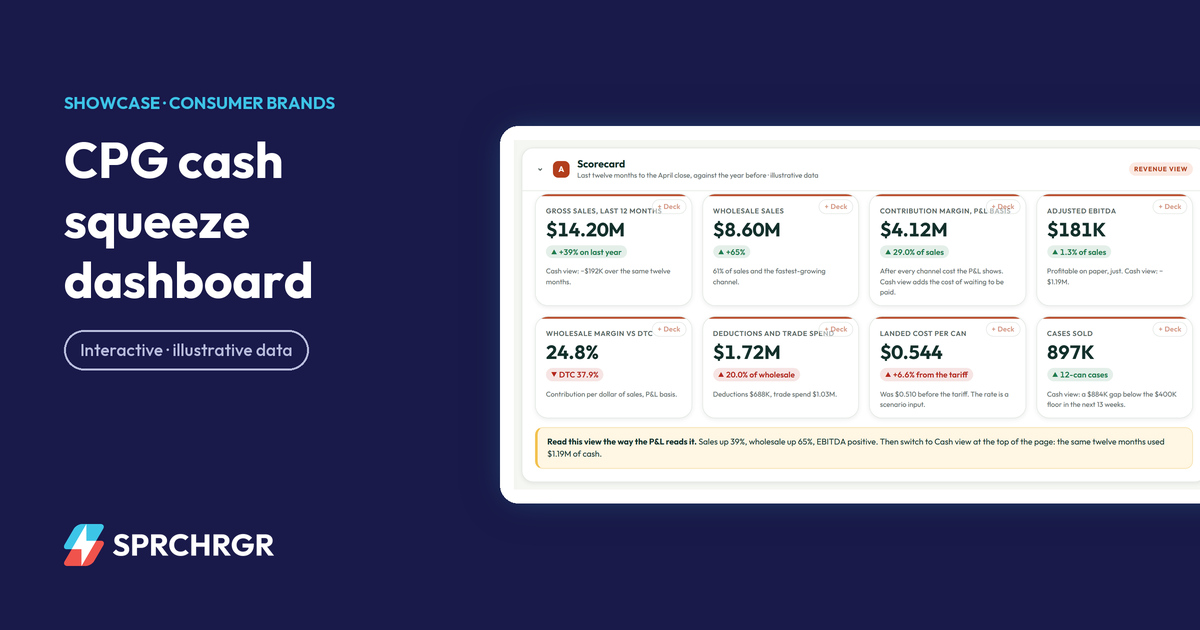
Channel margin after every cost, days of cash tied up per channel, tariff pass-through, a 13-week cash forecast and the financing that closes the gap.
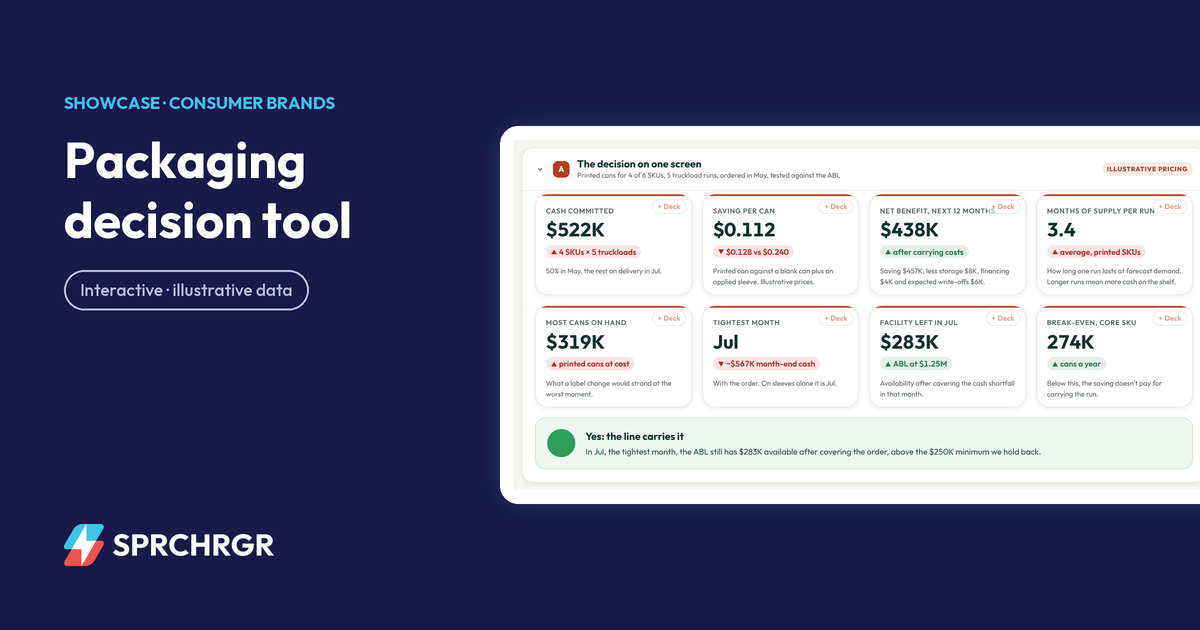
Printed cans or sleeves: unit savings against cash committed, months of supply, storage and obsolescence, and the seasonal month the order pinches.
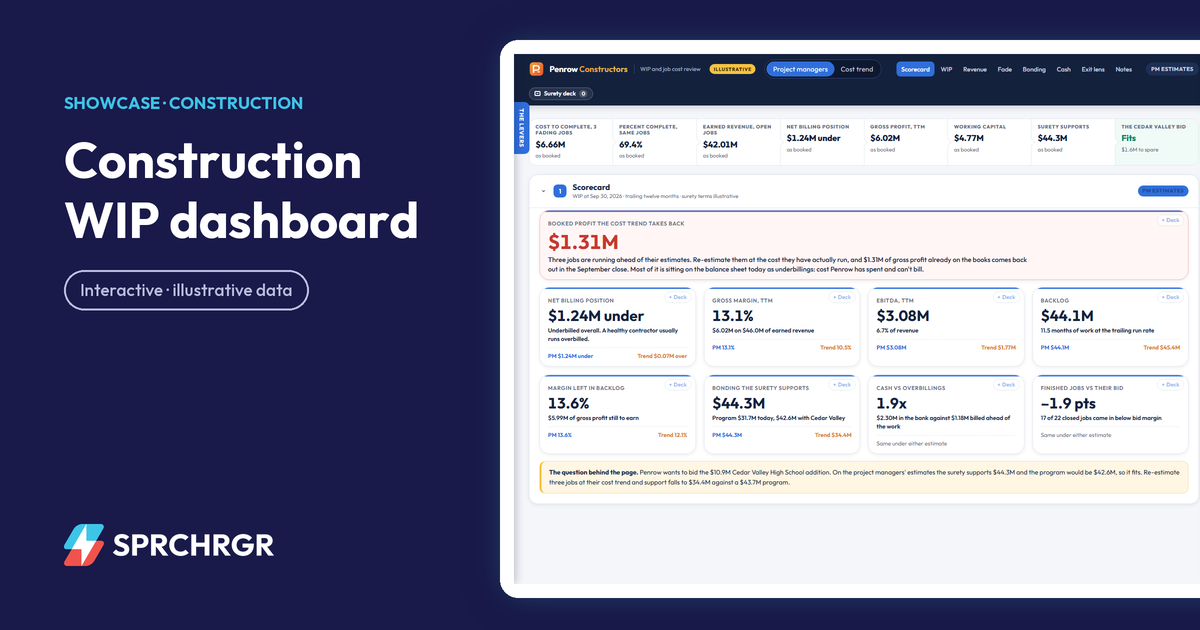
The WIP schedule with over and under billings, job fade against bid, backlog burn-off and the bonding capacity a surety will actually extend.
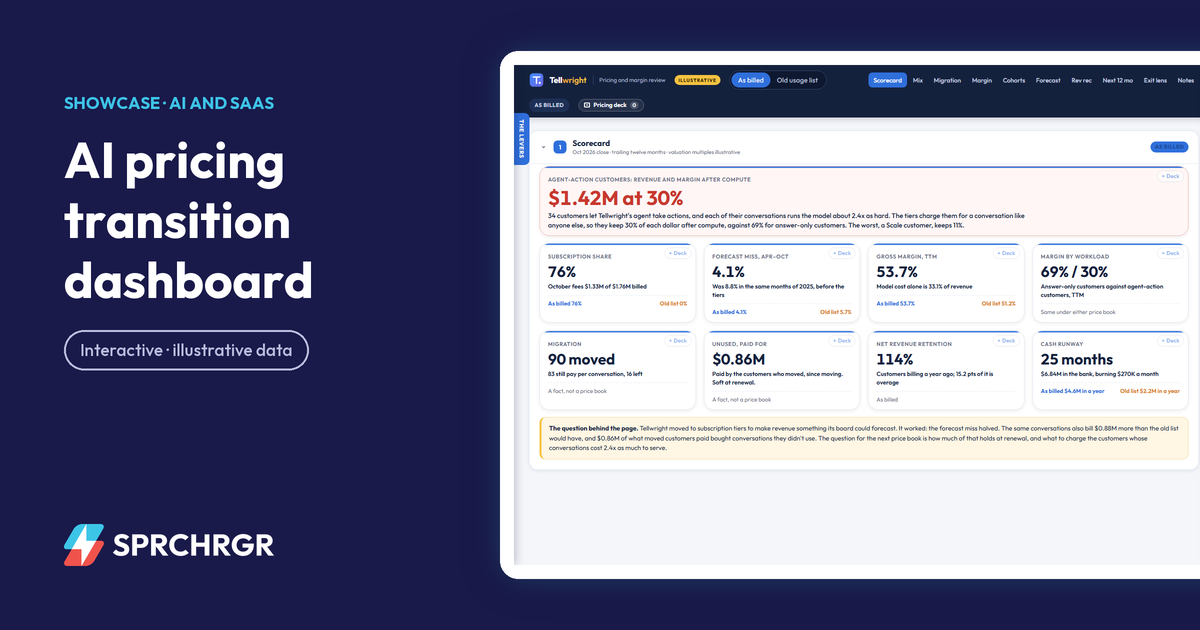
What moving from usage billing to subscription tiers did to revenue, gross margin after compute and forecast accuracy, customer by customer.
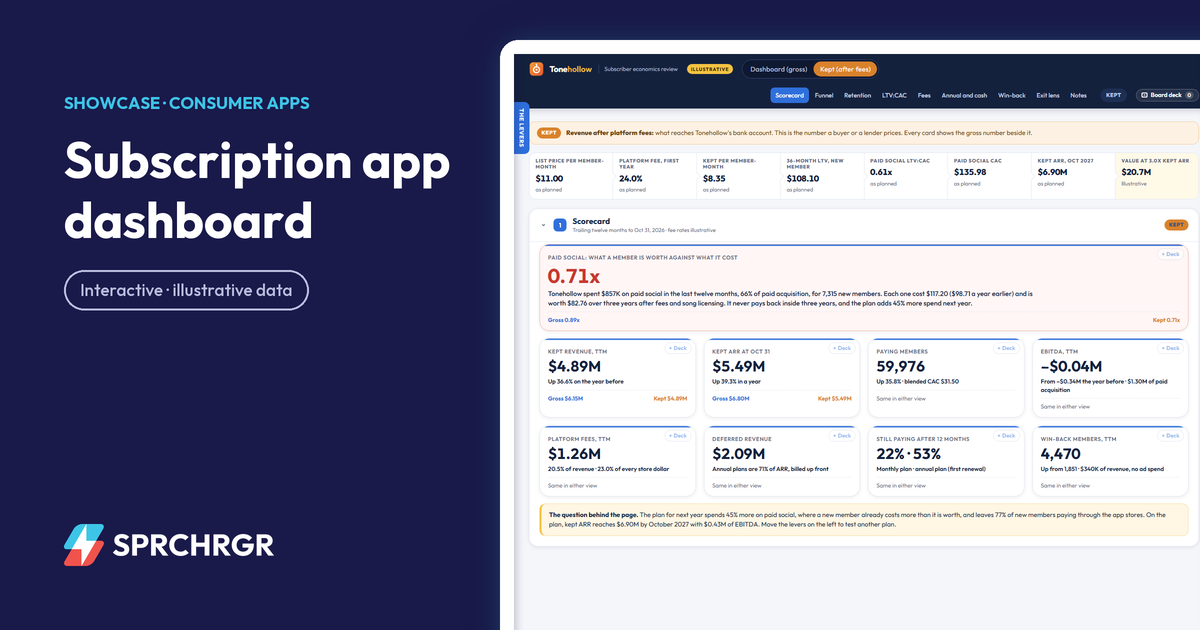
Funnel, cohort retention by plan, LTV:CAC by channel, what the app stores keep against web checkout, and annual-plan cash timing.
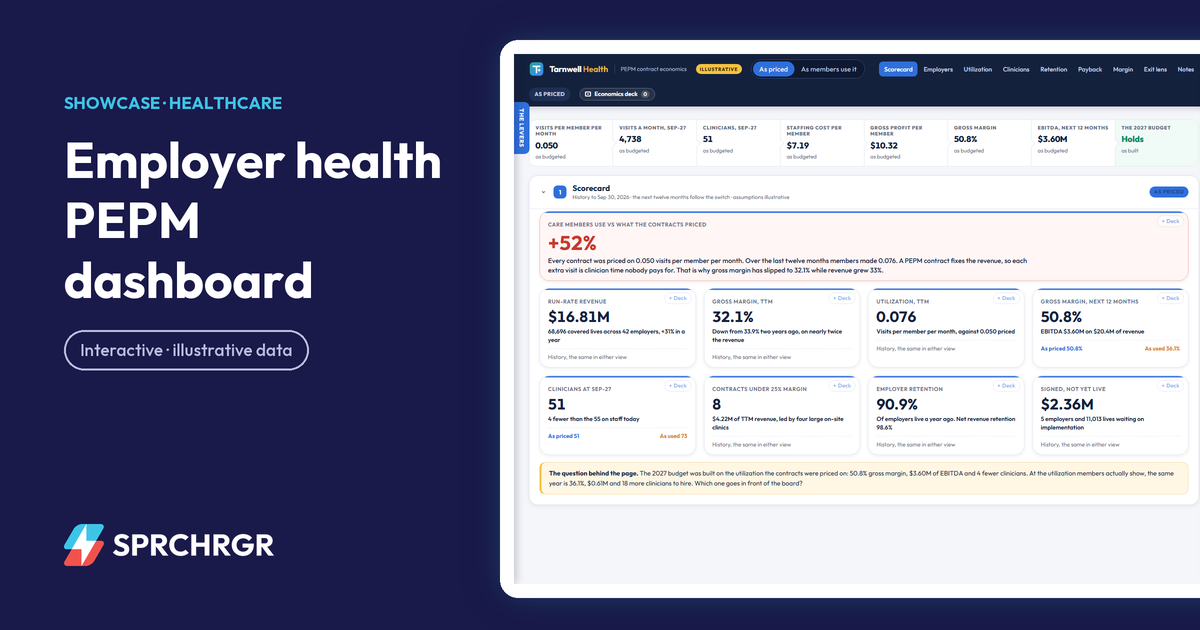
Contract margin employer by employer, utilization against what the price assumed, clinician staffing and payback on a per-employee price.
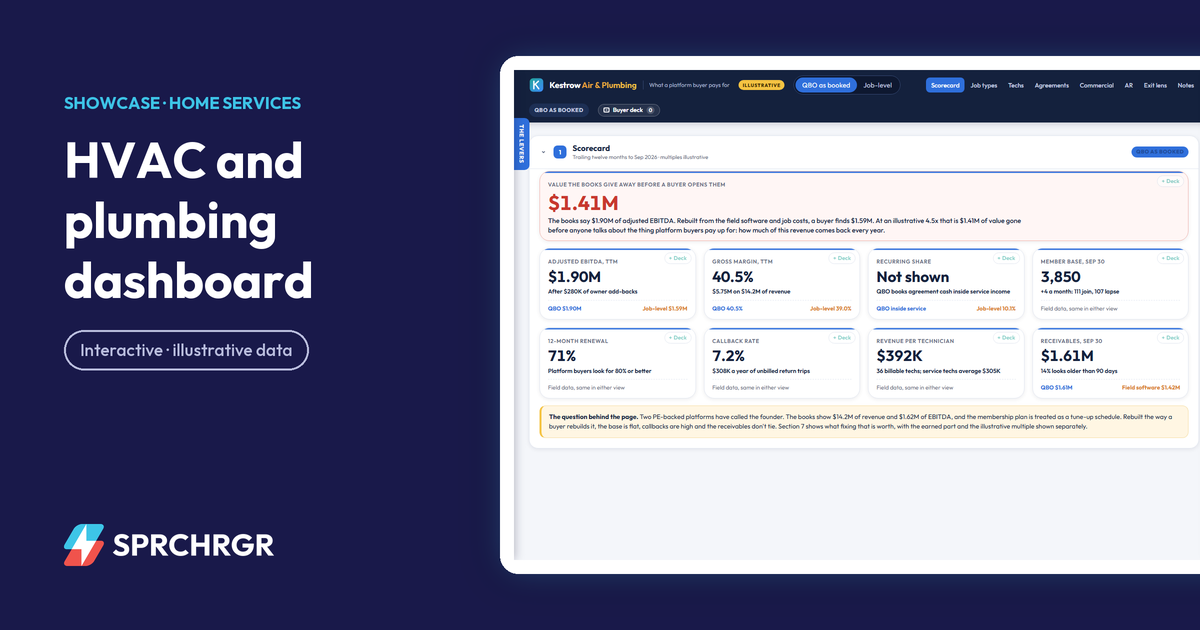
Margin by job type, technician callbacks, the membership base a platform buyer underwrites, and the receivables bridge from the field software to QBO.
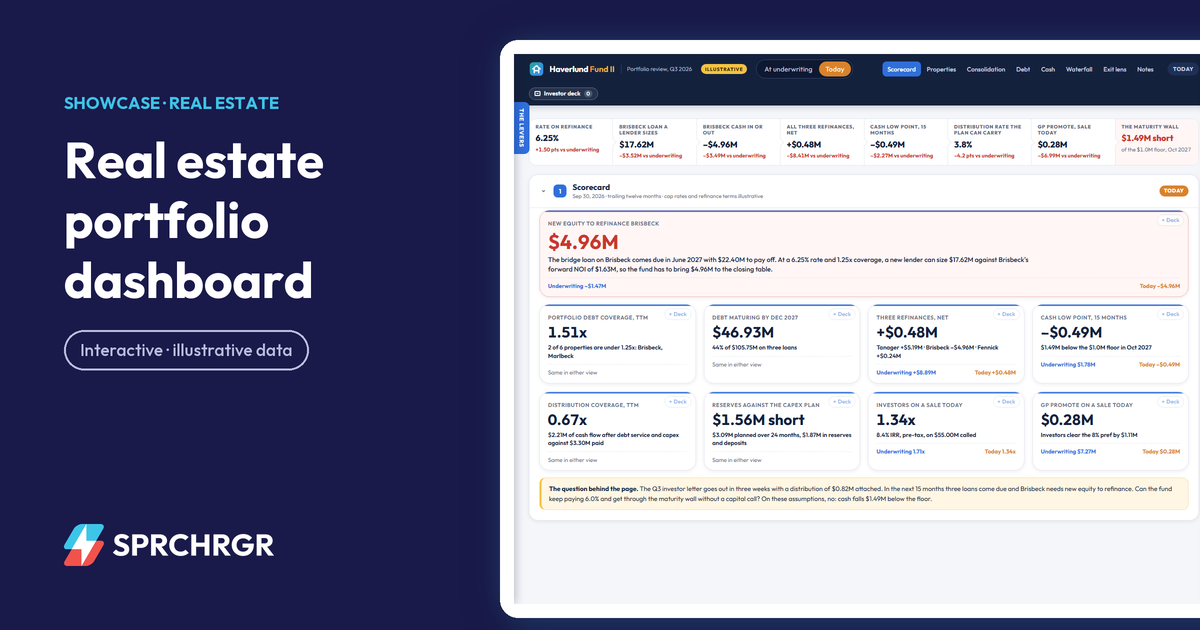
NOI and debt coverage by property, the loan maturity wall and refinance math, the distribution against the cash plan, and the LP waterfall.
No demo matches both filters yet. or ask us to build that one.

Multiple systems create siloed information and inconsistent reporting. We integrate financial, operational, and customer data into a single source of truth.


We create automated reporting solutions that deliver real-time insights. No more wasted hours spent gathering and formatting data for executive meetings.


A lack of timely data delays critical business decisions. We build visibility of critical trends so you can stay ahead of the curve.


Too much data, not enough insight? We transform complex data into clear, actionable ideas that embolden your next moves.


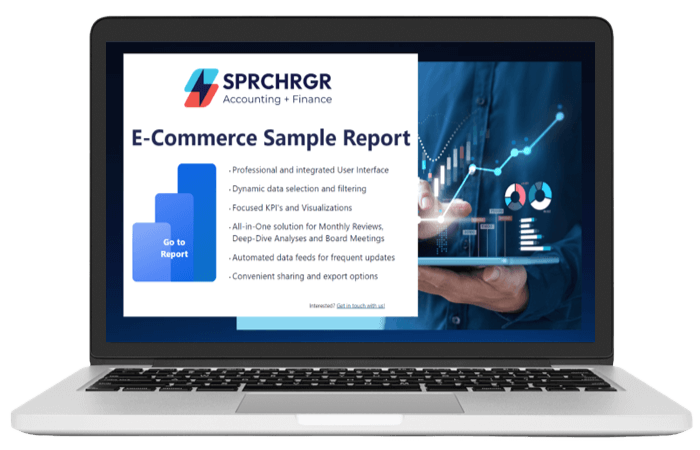
360° visibility of your operations
We build live KPI dashboards powered by industry-leading technology applications like Microsoft Power BI

Client Story: Data Visualization
“Every step of the way, they helped us build and analyze financial models that led to the right decisions. We felt confident in our direction and were ready for future due diligence, internal staffing, and investor reporting needs.”
Ross Richmond
Co-Founder & Co-CEO | Arrive


meet our team
“The data is only insightful when it is understood. We transform financial data to tell a story that everyone in the organization can easily access and use to make faster decisions."
Mark Wald
Founder & CEO

Article
Software-based businesses have a head start: They're built with the right infrastructure and mindset to generate data-driven insights into the company's fi...


Article
California just did something it had resisted for years. On June 29, 2026, Governor Newsom signed SB 122, a 2026-27 budget bill that extends the state's sa...

Article
"The most dangerous kind of waste is the waste we do not recognize." When Dr. Shigeo Shingo, pioneer of Toyota's Lean manufacturing, made this observation,...

ARTICLE
Like many aspects of e-commerce today, sales taxes have become exponentially more complicated. What used to be straightforward for brick-and-mortar retaile...

Article
Despite the clear benefits of automation, many finance leaders remain stuck in manual processes — not because they don't see the value, but because they've...


Article
Private investors don’t pay for yesterday’s profits. They pay for tomorrow’s predictable profits, the pace of growth, and how well risk is managed. Great f...

Article
In finance, your decisions are only as strong as the data you base them on. But if key insights are delayed by days, weeks — or worse, don’t exist — strate...

Article
As your firm has grown, you’ve stitched together a time tracker, a billing tool, QuickBooks, and a sea of Excel spreadsheets. You might also have a simple ...

Article
You’re scaling—bigger clients, more projects, new hires. But instead of gaining momentum, your operations are slowing down. Why? Because your core financia...

Article
The project looked profitable — until it wasn't. But too often, project managers are flying blind while relying on backward-looking spreadsheets and best g...


ARTICLE
Is your firm's brightest talent spending precious hours on administrative busywork instead of billable client work—silently eroding your bottom line? The m...